Copyright
©2008 The WJG Press and Baishideng.
World J Gastroenterol. Jul 28, 2008; 14(28): 4492-4498
Published online Jul 28, 2008. doi: 10.3748/wjg.14.4492
Published online Jul 28, 2008. doi: 10.3748/wjg.14.4492
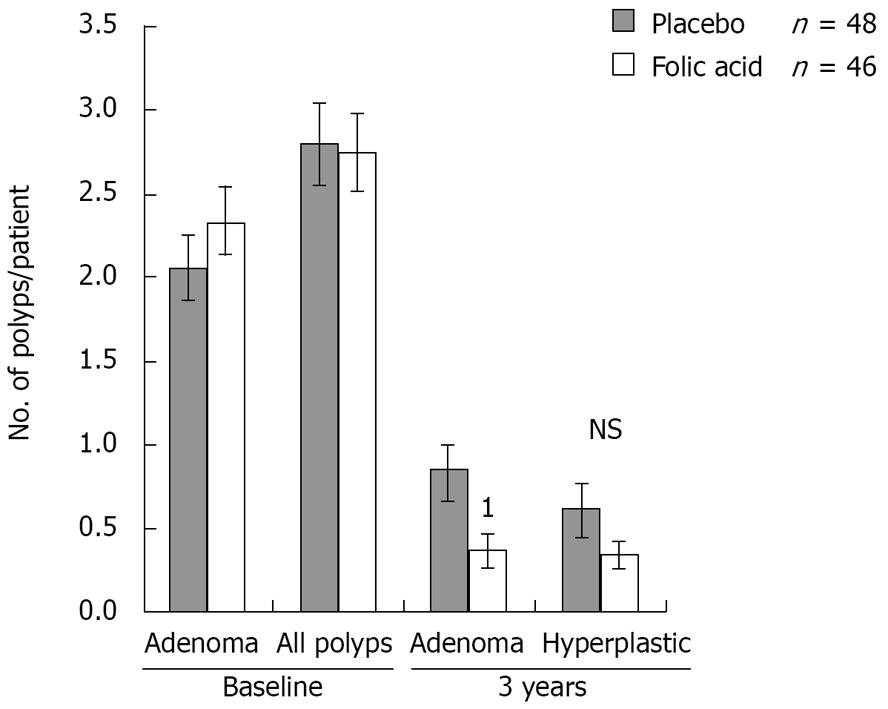
Figure 1 Number of adenomas versus treatment.
Histograms showing the number of adenomas or all types of polyps in folic acid and placebo-treated groups at baseline and 3 years after treatment. 1P = 0.02514, compared to the placebo-treated group. Each histogram represents the mean ± SD.
- Citation: Jaszewski R, Misra S, Tobi M, Ullah N, Naumoff JA, Kucuk O, Levi E, Axelrod BN, Patel BB, Majumdar AP. Folic acid supplementation inhibits recurrence of colorectal adenomas: A randomized chemoprevention trial. World J Gastroenterol 2008; 14(28): 4492-4498
- URL: https://www.wjgnet.com/1007-9327/full/v14/i28/4492.htm
- DOI: https://dx.doi.org/10.3748/wjg.14.4492


