Copyright
©2008 The WJG Press and Baishideng.
World J Gastroenterol. Jul 7, 2008; 14(25): 4020-4027
Published online Jul 7, 2008. doi: 10.3748/wjg.14.4020
Published online Jul 7, 2008. doi: 10.3748/wjg.14.4020
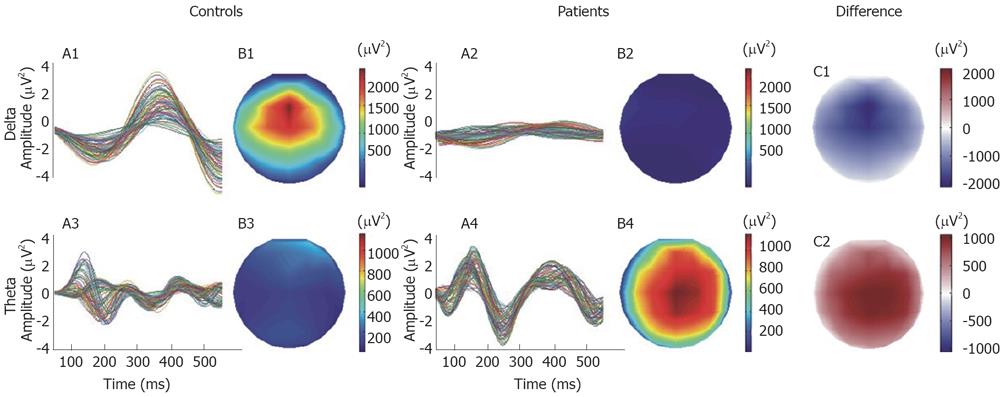
Figure 3 The temporal evolution and the spatial distribution maps of energy of the delta and theta activities for the 450 ms of analysis.
In the right panel, the difference maps of energy were computed by subtracting the energy maps of controls from the patients.
- Citation: Drewes AM, Gratkowski M, Sami SA, Dimcevski G, Funch-Jensen P, Arendt-Nielsen L. Is the pain in chronic pancreatitis of neuropathic origin? Support from EEG studies during experimental pain. World J Gastroenterol 2008; 14(25): 4020-4027
- URL: https://www.wjgnet.com/1007-9327/full/v14/i25/4020.htm
- DOI: https://dx.doi.org/10.3748/wjg.14.4020


