Copyright
©2008 The WJG Press and Baishideng.
World J Gastroenterol. Jul 7, 2008; 14(25): 4020-4027
Published online Jul 7, 2008. doi: 10.3748/wjg.14.4020
Published online Jul 7, 2008. doi: 10.3748/wjg.14.4020
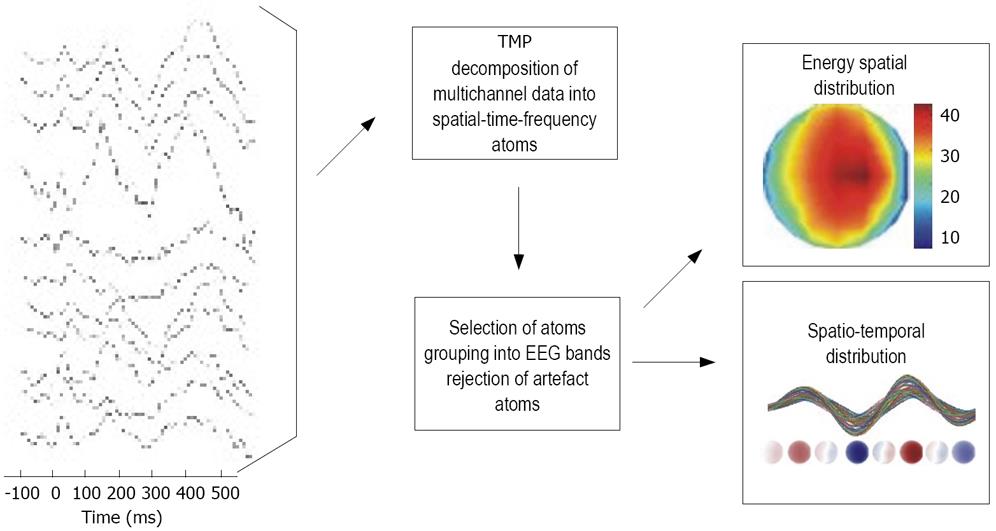
Figure 1 The analysis scheme used for the data investigation.
The EEG data were decomposed into a set of TMP atoms, which parameterized the data. Next, the atoms were grouped into bands according to their frequency parameter. This allowed convenient analysis of time and spatial properties of oscillations in all frequency bands.
- Citation: Drewes AM, Gratkowski M, Sami SA, Dimcevski G, Funch-Jensen P, Arendt-Nielsen L. Is the pain in chronic pancreatitis of neuropathic origin? Support from EEG studies during experimental pain. World J Gastroenterol 2008; 14(25): 4020-4027
- URL: https://www.wjgnet.com/1007-9327/full/v14/i25/4020.htm
- DOI: https://dx.doi.org/10.3748/wjg.14.4020


