Copyright
©2008 The WJG Press and Baishideng.
World J Gastroenterol. Jun 21, 2008; 14(23): 3710-3718
Published online Jun 21, 2008. doi: 10.3748/wjg.14.3710
Published online Jun 21, 2008. doi: 10.3748/wjg.14.3710
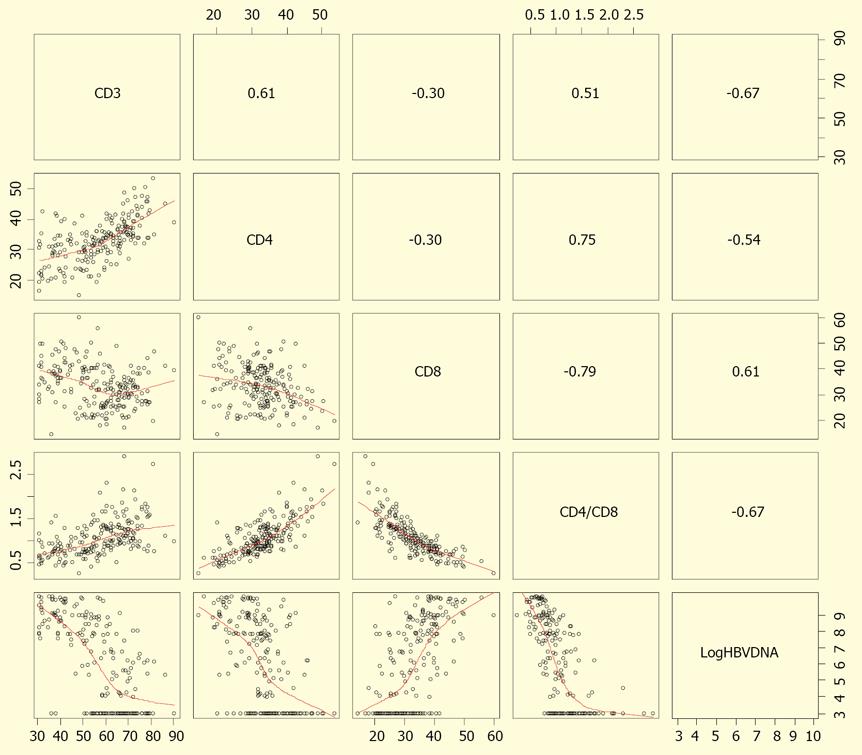
Figure 1 Correlation between peripheral T-cell subsets and serum HBV viral load.
The numbers in the boxes refer to correlation coefficients. There is a negative correlation between the CD3+and CD4+ cells and CD4+/CD8+ ratio and serum viral load in CHI individuals with normal LFTs (r = -0.67, -0.54, -0.67; P < 0.0001), and a positive correlation between the levels of CD8+ cells and viral load (r = 0.61, P < 0.0001).
- Citation: You J, Sriplung H, Geater A, Chongsuvivatwong V, Zhuang L, Chen HY, Huang JH, Tang BZ. Hepatitis B virus DNA is more powerful than HBeAg in predicting peripheral T-lymphocyte subpopulations in chronic HBV-infected individuals with normal liver function tests. World J Gastroenterol 2008; 14(23): 3710-3718
- URL: https://www.wjgnet.com/1007-9327/full/v14/i23/3710.htm
- DOI: https://dx.doi.org/10.3748/wjg.14.3710


