Copyright
©2008 The WJG Press and Baishideng.
World J Gastroenterol. Apr 21, 2008; 14(15): 2349-2357
Published online Apr 21, 2008. doi: 10.3748/wjg.14.2349
Published online Apr 21, 2008. doi: 10.3748/wjg.14.2349
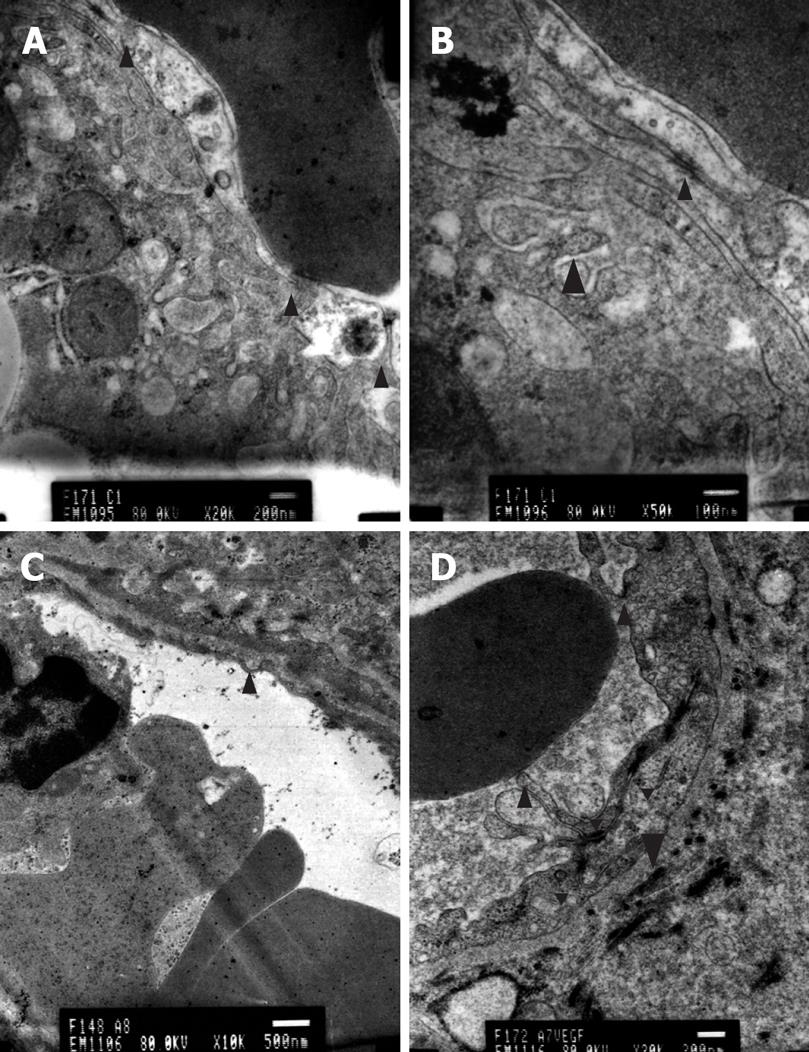
Figure 5 TEM.
A: Normal state, LSECs and fenestrae (arrowhead). Bar denotes 200 nm; B: Normal state. Cell conjuction between LECs (small arrowhead) and microvilli of hepatocytes (large arrowhead). Bar denotes 100 nm; C: Cirrhotic state. Fenestrae, cell conjuction and microvilli of hepatocytes disappeared, and a basement membrane appeared (arrowhead). Bar denotes 500 nm; D: VEGF treated group. Fenestrae (small arrowhead), microvilli (large arrowhead) and cell conjunctions between LECs (triangle) appeared, Bar denotes 200 nm.
- Citation: Xu H, Shi BM, Lu XF, Liang F, Jin X, Wu TH, Xu J. Vascular endothelial growth factor attenuates hepatic sinusoidal capillarization in thioacetamide-induced cirrhotic rats. World J Gastroenterol 2008; 14(15): 2349-2357
- URL: https://www.wjgnet.com/1007-9327/full/v14/i15/2349.htm
- DOI: https://dx.doi.org/10.3748/wjg.14.2349


