
















©2008 The WJG Press and Baishideng.
World J Gastroenterol. Apr 7, 2008; 14(13): 2010-2022
Published online Apr 7, 2008. doi: 10.3748/wjg.14.2010
Published online Apr 7, 2008. doi: 10.3748/wjg.14.2010
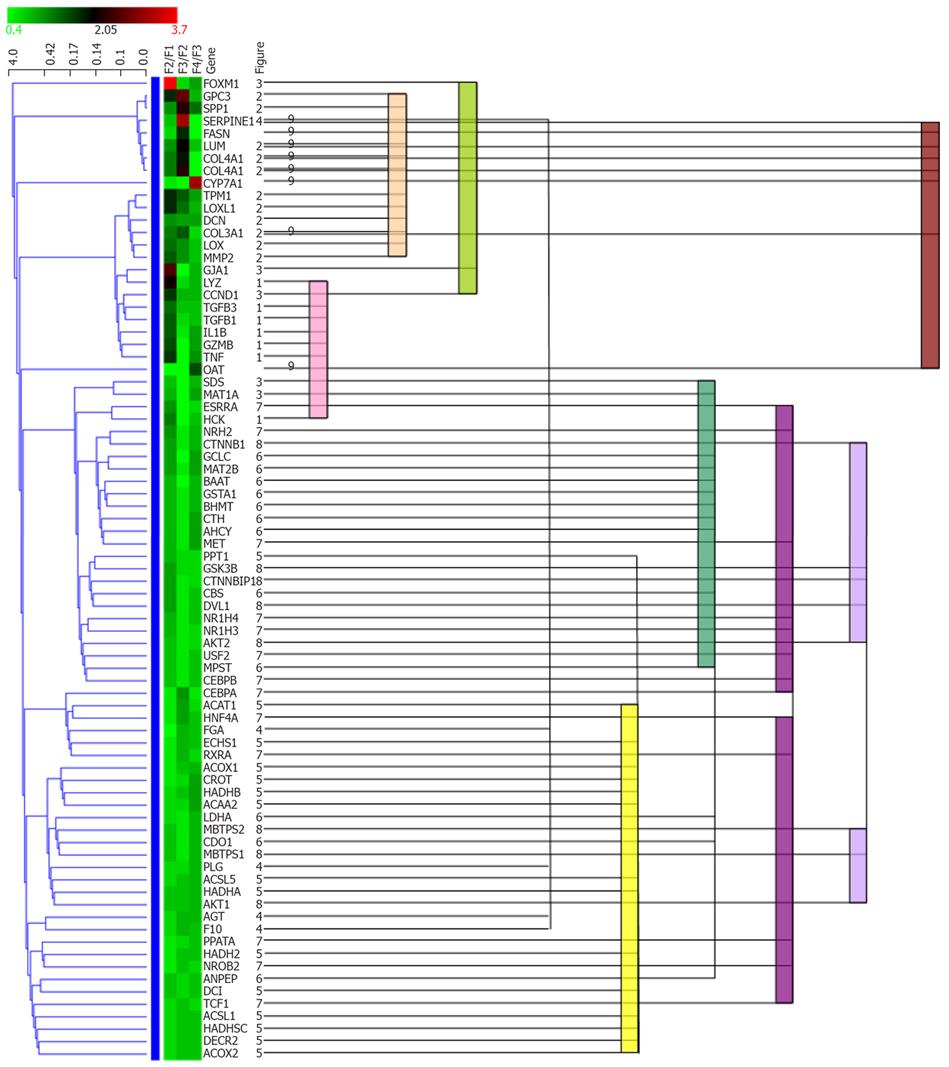
Figure 2 Comparison between statistical clustering analysis and functional cluster.
All genes in Figure 1 were subjected to hierarchical clustering analysis using Genowiz™. Statistical clustering of the expression ratio between neighboring F stages for the genes in Table 1 was combined with functional categories. The color coding in the center column shows the expression ratio between neighboring F stages for the genes in Table 1: Ratio increases from green to red. The left dendrogram shows the result of hierarchical clustering by Genowiz™ software. The numbers on the right of gene names indicate the subgraph numer in Figure 1, which represents functional categories, and the same numbers are tied with color bars.
- Citation: Takahara Y, Takahashi M, Zhang QW, Wagatsuma H, Mori M, Tamori A, Shiomi S, Nishiguchi S. Serial changes in expression of functionally clustered genes in progression of liver fibrosis in hepatitis C patients. World J Gastroenterol 2008; 14(13): 2010-2022
- URL: https://www.wjgnet.com/1007-9327/full/v14/i13/2010.htm
- DOI: https://dx.doi.org/10.3748/wjg.14.2010