Copyright
©2008 The WJG Press and Baishideng.
World J Gastroenterol. Mar 14, 2008; 14(10): 1553-1558
Published online Mar 14, 2008. doi: 10.3748/wjg.14.1553
Published online Mar 14, 2008. doi: 10.3748/wjg.14.1553
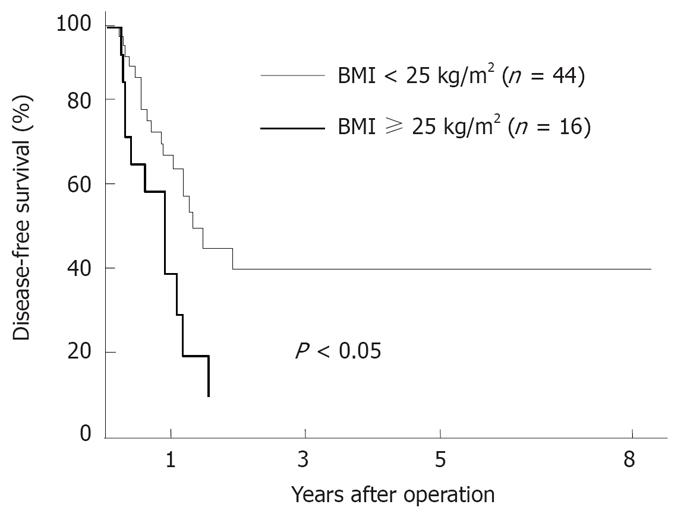
Figure 4 Comparison of the survival curves after a repeat hepatectomy in the nonobese group (BMI < 25 kg/m2, n = 44) versus the obese group (BMI ≥ 25 kg/m2, n = 16).
A significantly shorter disease-free survival was found in the obese group than in the nonobese group (P < 0.05).
- Citation: Utsunomiya T, Okamoto M, Kameyama T, Matsuyama A, Yamamoto M, Fujiwara M, Mori M, Aimitsu S, Ishida T. Impact of obesity on the surgical outcome following repeat hepatic resection in Japanese patients with recurrent hepatocellular carcinoma. World J Gastroenterol 2008; 14(10): 1553-1558
- URL: https://www.wjgnet.com/1007-9327/full/v14/i10/1553.htm
- DOI: https://dx.doi.org/10.3748/wjg.14.1553


