Copyright
©2008 The WJG Press and Baishideng.
World J Gastroenterol. Mar 14, 2008; 14(10): 1514-1520
Published online Mar 14, 2008. doi: 10.3748/wjg.14.1514
Published online Mar 14, 2008. doi: 10.3748/wjg.14.1514
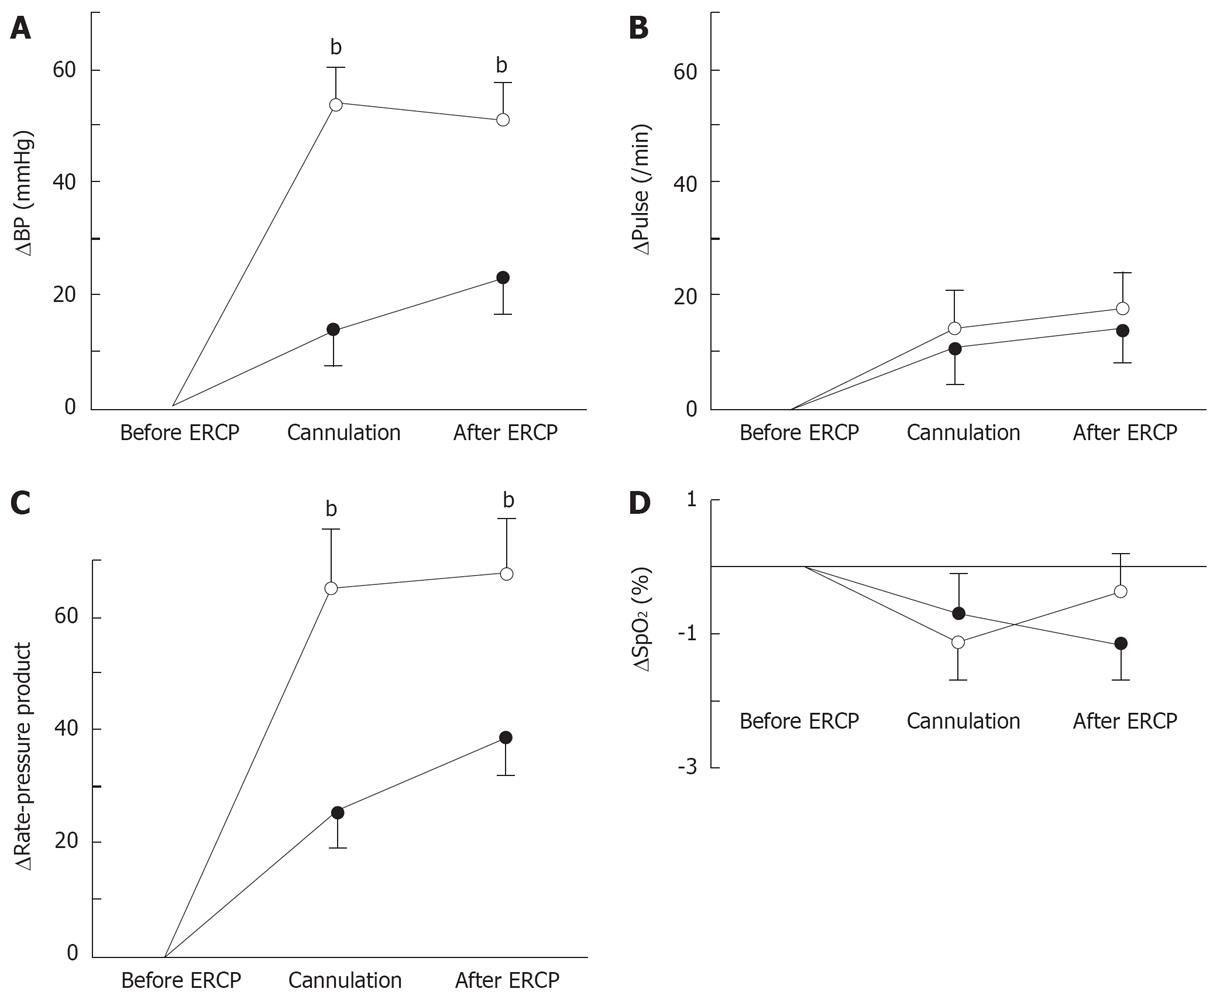
Figure 3 Cardiovascular parameters during the ERCP procedure.
A-D show the changes in systolic blood pressure (A), pulse rate (B), rate-pressure product (C) and peripheral blood oxygen saturation (D). The changes of the parameters were calculated as described in the text. Open and closed circles show the oral and transnasal ERCP, respectively. Each parameter was measured before performing ERCP, just before the cannulation and at the completion of the ERCP procedure. Values represent the mean ± SE. bP < 0.001.
- Citation: Mori A, Ohashi N, Maruyama T, Tatebe H, Sakai K, Shibuya T, Inoue H, Takegoshi S, Okuno M. Transnasal endoscopic retrograde chalangiopancreatography using an ultrathin endoscope: A prospective comparison with a routine oral procedure. World J Gastroenterol 2008; 14(10): 1514-1520
- URL: https://www.wjgnet.com/1007-9327/full/v14/i10/1514.htm
- DOI: https://dx.doi.org/10.3748/wjg.14.1514


