
















©2007 Baishideng Publishing Group Co.
World J Gastroenterol. Mar 7, 2007; 13(9): 1378-1383
Published online Mar 7, 2007. doi: 10.3748/wjg.v13.i9.1378
Published online Mar 7, 2007. doi: 10.3748/wjg.v13.i9.1378
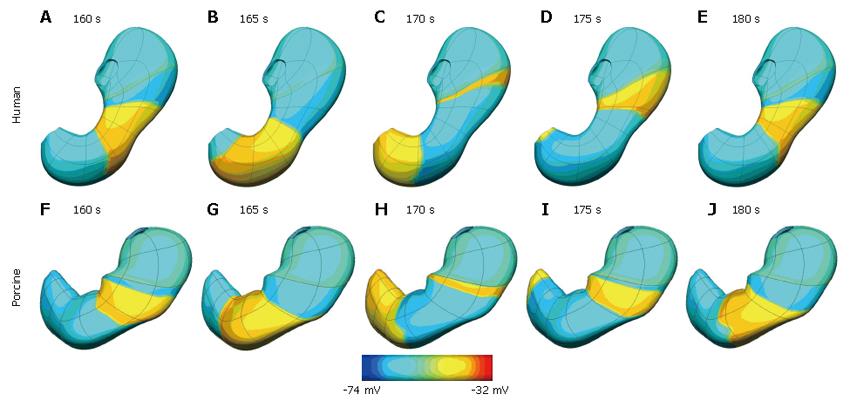
Figure 4 Simulation results at five second intervals showing gastric slow wave activity wave in a human (A-E) and porcine (F-J) stomach.
The human stomach has a dominant frequency of 3.0 cpm while the porcine model has a dominant frequency of 3.7 cpm. Shown above is the transmembrane potential distribution on the outer surface of the stomach coloured by the scale bar below the images.
- Citation: Cheng LK, Komuro R, Austin TM, Buist ML, Pullan AJ. Anatomically realistic multiscale models of normal and abnormal gastrointestinal electrical activity. World J Gastroenterol 2007; 13(9): 1378-1383
- URL: https://www.wjgnet.com/1007-9327/full/v13/i9/1378.htm
- DOI: https://dx.doi.org/10.3748/wjg.v13.i9.1378