Published online Mar 7, 2007. doi: 10.3748/wjg.v13.i9.1372
Revised: December 21, 2006
Accepted: January 5, 2007
Published online: March 7, 2007
The objective of this research was to use abdominal computed tomography (CT) scans to non-invasively quantify anthropometrical data of the human stomach and to concomitantly create an anatomically correct and distensible ex-vivo gastric model. Thirty-three abdominal CT scans of human subjects were obtained and were imported into reconstruction software to generate 3D models of the stomachs. Anthropometrical data such as gastric wall thickness, gastric surface area and gastric volume were subsequently quantified. A representative 3D computer model was exported into a selective laser sintering (SLS) rapid prototyping machine to create an anatomically correct solid gastric model. Subsequently, a replica wax template of the SLS model was created. A negative mould was offset around the wax template such that the offset distance was equivalent to that of the gastric wall thickness. A silicone with similar mechanical properties to the human stomach was poured into the offset. The lost wax manufacturing technique was employed to create a hollow distensible stomach model. 3D computer gastric models were generated from the CT scans. A hollow distensible silicone ex-vivo gastric model with similar compliance to that of the human stomach was created. The anthropometrical data indicated that there is no significant relationship between BMI and gastric surface area or gastric volume. There were inter- and intra-group differences between groups with respect to gastric wall thickness. This study demonstrates that abdominal CT scans can be used to both non-invasively determine gastric anthropometrical data as well as create realistic ex-vivo stomach models.
-
Citation: Henry JA, O’Sullivan G, Pandit AS. Using computed tomography scans to develop an
ex-vivo gastric model. World J Gastroenterol 2007; 13(9): 1372-1377 - URL: https://www.wjgnet.com/1007-9327/full/v13/i9/1372.htm
- DOI: https://dx.doi.org/10.3748/wjg.v13.i9.1372
Computed tomography (CT) is a non-invasive radiological examination tool which is capable of producing superior diagnostic images of soft tissue organs, such as the stomach, compared to other radiographic procedures[1-4]. Diagnostic imaging techniques have been used to extract anthropometrical data of the human stomach such as gastric wall thickness, surface area and volume[1,5,6]. Researchers investigating obesity have considered whether obese persons have a significantly larger gastric volume than non-obese persons[6].
Whilst employing diagnostic imaging scans for quantitative analysis, it is also possible to transform diagnostic scans into computer aided design models. Magnetic resonance angiography (MRA) scans have been used to create ex-vivo compliant tissue models[7]. MRA scans were exported into computer software and later manipulated through rapid prototyping techniques to create solid models, which were subsequently used to develop hollow arterial models.
Rapid prototyping (RP) is a fabrication method which enables accurate and economic reproduction of devices or models without the need for tooling[8]. Files from computer aided design software may be exported to a variety of RP processes such as 3D printing, stereolithography and selective laser sintering to produce solid prototypes. These prototypes may in turn be used to cast hollow models using moulding techniques.
The lost wax process is a mould fabrication method for creating thin-walled objects[9]. Using solid rapid-prototyped objects as a template, it is possible to produce high detail hollow objects after offsetting the template with a low melting point material such as wax.
The objectives of this study were: (1) to demonstrate that abdominal CT scans could be used to consistently quantify anthropometric parameters of the human stomach, specifically gastric wall thickness, surface area and volume of non-obese and obese patients and (2) develop an anatomically correct, distensible ex-vivo stomach model using abdominal CT scans.
Data are expressed as mean ± SD. Statistical analysis was performed using Minitab® (v. 13, Minitab, Inc. PA, USA). Statistical comparisons were made by analysis of variance (ANOVA). Tukey’s honestly square difference was used for post-hoc analyses to determine statistical difference between groups. A p-value of < 0.05 was considered to be statistically significant. Regression analysis compared BMI against gastric surface area and volume.
The abdominal CT scans of 33 patients were obtained (Siemens Somatom Emotion 6TM Power CT scanner, Siemens Medical Systems, Germany) from Merlin Park Imaging Centre, Merlin Park Hospital, Galway, after an approval from the Ethics Committee of the National University of Ireland, Galway. Patients mass and height were recorded and the patient’s body mass index (BMI) was determined according to the World Health Organisation (WHO) definition.
BMI is calculated by dividing a persons mass (kilograms) by the square of their height (m2). GroupI(n = 19) contained those with a BMI between 17.58-24.9 kg/m2, considered underweight-normal by the WHO, while Group II (n = 14) comprised those with a BMI between 25.0-39.66 kg/m2, deemed clinically overweight-obese by the WHO.
The mean BMI of GroupIwas 21.83kg/m2 while the mean BMI of GroupIIwas 29.27 kg/m2. Grubb’s test to identify outliers was applied to the raw data before statistical analysis. No patient in either GroupIor Group II was identified as outliers. Both categories were statistically different (P < 0.05) to each other with respect to their mass and BMI, as shown in Table 1.
| BMI 17.58-24.9 kg/m2 | BMI 25.0-39.66 kg/m2 | |
| n = 19 | n = 14 | |
| Height (m) | 1.69 ± 0.10 | 1.69 ± 0.10 |
| Mass (kg) | 62.50 ± 10.25a | 83.61 ± 11.34a |
| BMI (kg/m2) | 21.83 ± 2.16c | 29.27 ± 3.79c |
The CT scans were individually imported into a 3D reconstruction software package (MIMICSTM, Materialise, UK), as per Figure 1A. Upon being imported into the 3D reconstruction software package, the anterior, posterior and lateral orientations of the patient were defined. The transaxial plane images were used for all patients as the stomach was discriminately defined in this plane. The grey-scale of the scans was adjusted to differentiate the stomach from adjacent organs such as the spleen and liver. The threshold level was set by drawing a profile line across a cross-section of the stomach. The threshold levels were established by adjusting the HounsField units, which accentuated the stomach on all the CT scans with a mask, as shown in Figure 1B. An editing tool was utilised to remove any superfluous thresholding that may have been picked up by adjacent organs. Smoothing algorithms were used to remove any undesirable edge effects due to pixilation and to optimise the geometries of the anatomically correct stomachs.
Having edited the CT slices to isolate the stomach, the slices were grouped together to form a 3D image of the stomach. The 3D stomach images were saved in “.stl” format and exported to a rapid prototype machine.
Upon manipulating the CT slices to isolate the stomach, the slices were grouped together to form a 3D image of the stomach. The 3D images were attained by choosing the region growing function. Gastric volumes and gastric surface areas were determined from the 3D images. The gastric surface area and gastric volume 3D images were further divided into proximal and distal sections to investigate whether there were significant differences between these sections. Half-way between the uppermost point on the fundus and the pyloric sphincter defined the proximal and distal stomach, as shown in Figure 2.
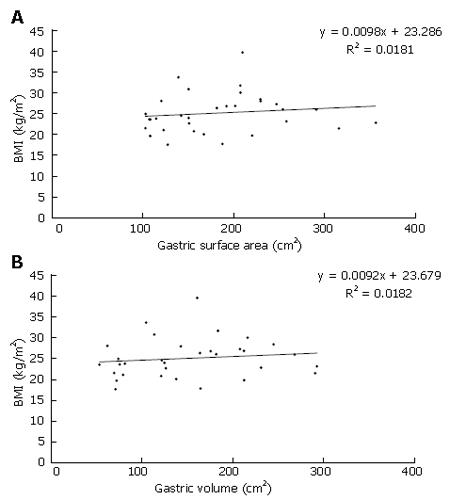
There were no significant differences between Group Iand Group II when comparing their gastric surface areas or volumes, as shown in Table 2. Gender had no influence on gastric volume or surface area. There were no significant differences between the groups with respect to proximal and distal gastric surface area and gastric volume data (Table 3). The regression graphs of BMI against gastric surface area and volume are shown in Figure 3A and B respectively. The low regression coefficient values in Figure 4 indicate that there is no linear relationship when comparing BMI to gastric surface area or volume.
| BMI(kg/m2) | Proximal GV(cm3) | Distal GV(cm3) | Proximal GSA(cm2) | Distal GSA(cm2) |
| 17.58-24.90 kg/m2 | 78 ± 54 | 91 ± 36 | 84 ± 36 | 76 ± 37 |
| 25.00-39.66 kg/m2 | 67 ± 52 | 87 ± 26 | 96 ± 31 | 94 ± 18 |
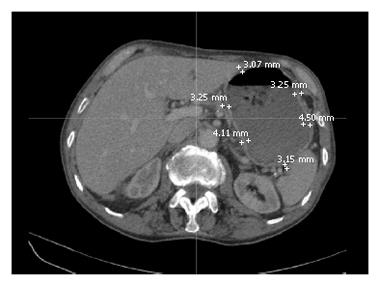
The tranverse slices were examined from the oesophagus to the pyloric sphincter. Due to the positioning of the patients on the CT scanner bed and the discrepancy in slice thickness (range 2.5-4.5 mm) between patients, there was variability between patients as to where the stomach became evident and when the stomach was no longer detectable in the CT scans. Using the electronic callipers on the 3D imaging reconstruction software, six representative gastric wall thickness measurements were taken on each slice, as in Figure 4. The location of each thickness was such that there were three anterior and posterior measurements, with equidistance between the points.
It was also investigated whether or not there was a difference between the anterior and posterior, and proximal and distal stomach with respect to gastric wall thickness. The anterior and posterior gastric regions were defined by drawing a horizontal line through the midpoint of the stomach on each CT slice. The proximal and distal gastric regions were defined as described previously.
Mean gastric wall thickness values varied between 2.35 and 5.43 mm. Table 4 indicates that there was no statistical difference in gastric wall thickness between GroupIand Group II. Analysis of the mean anterior and posterior gastric wall thicknesses revealed that location does not significantly influence gastric wall thickness, as per Table 5.
A 3D computer model file was recreated in a selective laser sintering machine (DTM SinterstationTM 2500 plus, 3D Systems Corp, USA). Powdered nylon was layered in 0.1 mm increments to produce a solid stomach model, which was then used to create a mould for the hollow stomach model. Solid stomach models were developed from the 3D computer models using the SLS machine. This solid model was used as a template to create the anatomically correct hollow distensible stomach model.
The next phase involved selecting a suitable polymer that possessed the same mechanical and distensibility properties as that of the stomach. Egorov et al[10] have previously determined the mechanical properties of the human stomach: modulus of elasticity about 0.4 MPa, elongation to break about 225%, ultimate tensile strength about 0.9 MPa. A silicone (Elastosil M4400TM, Wacker-Chemie GmbH, Germany) was identified as a polymer with similar distensibility to the human stomach.
A replica model of the rapid prototyped stomach was created using wax. The wax model was then offset using nylon reinforced modelling clay, which afforded a varying thickness similar to that of the stomach wall. The clay-covered model was secured in a retort stand via the rod. Subsequently, a two-part negative mould (plaster of Paris) of the clay model was created. Positioning guides were marked on and around the mould so as to later ensure accurate repositioning of the mould around the wax stomach.
Once set, the mould halves were opened and the modelling clay was removed, with the wax model still secured in the retort stand. A thin wax-coating (Shellac) was applied to the mould inner surfaces to aide removal of the silicone stomach afterwards. Using the pre-marked positioning indicators, the mould was repositioned around the wax model and sealed. Air holes were drilled into the mould at the oesophageal end and offset to the cardiac notch to allow any trapped air to escape. These locations were chosen as they were the two natural high points on the mould.
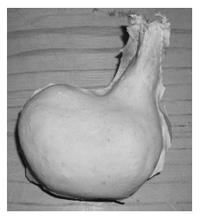
Silicone was poured in at the oesophageal end of the mould to fill the gap previously occupied by the modelling clay. The air-hole near the cardiac notch was plugged once silicone poured out of this hole. When the silicone came out of the air-hole at the oesophageal end the pouring process was deemed complete and the silicone was left to set for 24h. Thereafter, the silicone and wax stomach were placed in an oven at 80°C for 3 h to melt the wax out. The lost-wax process proved successful in fabricating an anatomically correct distensible stomach model, as in Figure 5. The exterior surface was smooth with an opening at the oesophageal end.
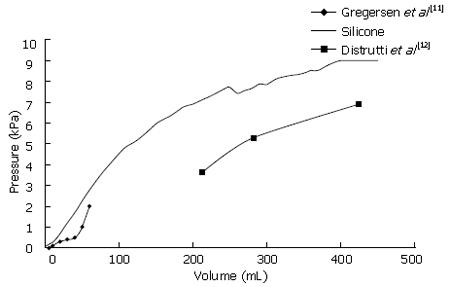
A non-destructive pressure-volume method was used to determine gastric compliance in the ex-vivo model. Gregerson et al[11] reported pressure-volume measurements of the human antrum by incrementally inflating an intra-gastric bag, while Distrutti and associates determined gastric compliance using a barostat[12].
For this study, a tube connected through a peristaltic pump (Watson-Marlow 323S, Watson-Marlow, UK) and a tube connected to a digital pressure gauge (ZSE30, SMC, Ireland) were inserted into the oesophageal end of the gastric model, which was then hermetically sealed. The peristaltic pump was programmed to inflate the gastric model using 10 mL increments of fluid, with a 1min interval between steps, up to 200 mL. Any resulting change in pressure after each volume increment was noted. This procedure was repeated twelve times on the same stomach, from which pressure-volume curves were derived.
The mean pressure-volume curve for the silicone stomach was plotted against literature values, as shown in Figure 6. Gregersen et al[11] reported on gastric compliance after low volumes (< 100 mL) of fluid were introduced into the stomach while Distrutti and colleagues reported on gastric compliance after introducing higher volumes of fluid (ca. 200-400 mL)[12]. It is evident from Figure 6 that the curves from literature have three distinctive curve slopes, reflecting the three muscle layers (longitudinal, circular and oblique) that surround the human stomach. The compliance curve for the silicone stomach has similar slopes to both literature values at low and high pressures. Furthermore, it is evident that the silicone stomach curve also has three different slopes, thus replicating the three gastric muscle layers.
The aim of this study was to demonstrate that it is possible to utilise abdominal CT scans to create an anatomically correct, distensible ex-vivo gastric model. An image reconstruction software package was used to create 3D gastric models from abdominal CT scans. These computer models were later exported to a rapid prototyping machine to produce solid, anatomically correct stomach models. The rapid prototyped models were used to develop plaster of Paris moulds. Using the lost wax process, an anatomically correct, hollow ex-vivo gastric model with similar compliance to that of the human stomach was developed.
Analysis of the anthropometrical data showed statistical differences between the groups when comparing their mass and BMI. However, the data in this study correlates with the fact that the WHO range values which define the BMI categories never overlap. Examination of the gastric surface area and volume data indicated no statistically significant difference between the two groups. Comparison of the proximal and distal gastric regions showed no significant difference in their surface area and volume. This finding suggests that both proximal and distal regions behave similarly when accommodating food. The gastric volume values in this study correlates with previous studies that also quantified gastric volume through non-invasive methods (Table 2)[6,13]. However we are unable to compare the distal and proximal gastric volumes in this study with the reported values as Kim et al[6] defined the proximal and distal regions differently, while Kuiken and colleagues did not specify the BMI of their patients[13]. Low regression coefficient values of BMI compared to gastric volume and surface area indicate that BMI is not an indicator of gastric surface area or gastric volume, or vice-versa.
There were both intra- and inter-group differences with respect to the gastric wall thickness. The inter-group variability was due to a number of reasons such as that some of the stomachs were fully distended whilst others were not, and there may have been gastric wall pseudothickening as a result of oblique sectioning by the CT scanner. Such a phenomenon has been previously reported by Pickhardt and Asher[1]. In this study, there was a wide range for the gastric wall thickness, between 2.35 and 5.43 mm, with the majority of gastric wall thickness measurements being between 3 and 4 mm. Previous examinations of gastric wall thickness have indicated a gastric wall thickness between 2.80 and 5 mm for fully distended stomachs, hence validating our findings[3,4,14]. Pickhardt and Asher reported values greater than 12mm for the gastric antrum wall thickness[1]. However, no such large values were found in this study.
The use of CT scans to determine the volume and surface area of the stomach hasn’t been reported thus far. Previous attempts to quantify gastric volume and surface area have relied on invasive methods such as intragastric barostat balloon[15,16], whilst non-invasive techniques have used single photon emission computed tomography (SPECT)[17], MRI[5] and endoscopic ultrasound[14]. However the aforementioned methods are not without their limitations such as poor image resolution, erroneous gastric volume measurements and difficulty in reproducibility[13,16-19]. Hence, the utilisation of CT scans would make an ideal method for non-invasive measurement of gastric accommodation.
Magnetic resonance angiography (MRA) scans and the lost core technique were used to accurately create an anthropomorphic model of the human carotid artery[7]. Thus far, there have been no reports of generating an ex-vivo gastric model using CT scans. Therefore, the described techniques in this study could be used to develop anatomically correct ex-vivo models of other systems or organs such as the respiratory system and heart. The ex-vivo gastric model in this study was validated by the similar compliance at both low and high pressures to the human data reported in literature[11,12,20].
Hence, it may concluded that it is possible to manipulate abdominal CT scans to obtain anatomically correct 3D models of the stomach, from which anthropometrical data can be obtained.
Ms. Susan Harty and Ms Sharon Clegg, Clinical Specialist Radiographers, Merlin Park Imaging Centre, Galway for their help attaining the CT scans. Dr. Stefan Lohfeld, National Centre for Biomedical Engineering Science, National University of Ireland, Galway for his help with the selective laser sintering machine. Mr. Raymond Quinn, Castlebar for his help with the moulding process.
S- Editor Liu Y L- Editor MC Govern E- Editor Che YB
| 1. | Pickhardt PJ, Asher DB. Wall thickening of the gastric antrum as a normal finding: multidetector CT with cadaveric comparison. AJR Am J Roentgenol. 2003;181:973-979. [PubMed] [DOI] [Cited in This Article: ] [Cited by in Crossref: 48] [Cited by in F6Publishing: 40] [Article Influence: 1.9] [Reference Citation Analysis (0)] |
| 2. | Komaki S. Normal or benign gastric wall thickening demonstrated by computed tomography. J Comput Assist Tomogr. 1982;6:1103-1107. [PubMed] [DOI] [Cited in This Article: ] [Cited by in Crossref: 17] [Cited by in F6Publishing: 19] [Article Influence: 0.5] [Reference Citation Analysis (0)] |
| 3. | Gossios KJ, Tsianos EV, Demou LL, Tatsis CK, Papakostas VP, Masalas CN, Merkouropoulos MC, Kontogiannis DS. Use of water or air as oral contrast media for computed tomographic study of the gastric wall: comparison of the two techniques. Gastrointest Radiol. 1991;16:293-297. [PubMed] [DOI] [Cited in This Article: ] [Cited by in Crossref: 27] [Cited by in F6Publishing: 31] [Article Influence: 0.9] [Reference Citation Analysis (0)] |
| 4. | Scatarige JC, DiSantis DJ. CT of the stomach and duodenum. Radiol Clin North Am. 1989;27:687-706. [PubMed] [Cited in This Article: ] |
| 5. | Schwizer W, Steingötter A, Fox M, Zur T, Thumshirn M, Bösiger P, Fried M. Non-invasive measurement of gastric accommodation in humans. Gut. 2002;51 Suppl 1:i59-i62. [PubMed] [DOI] [Cited in This Article: ] [Cited by in Crossref: 75] [Cited by in F6Publishing: 81] [Article Influence: 3.7] [Reference Citation Analysis (0)] |
| 6. | Kim DY, Camilleri M, Murray JA, Stephens DA, Levine JA, Burton DD. Is there a role for gastric accommodation and satiety in asymptomatic obese people? Obes Res. 2001;9:655-661. [PubMed] [DOI] [Cited in This Article: ] [Cited by in Crossref: 58] [Cited by in F6Publishing: 60] [Article Influence: 2.6] [Reference Citation Analysis (0)] |
| 7. | O'Flynn PM, Roche ET, Pandit AS. Generating an ex vivo vascular model. ASAIO J. 2005;51:426-433. [PubMed] [DOI] [Cited in This Article: ] [Cited by in Crossref: 16] [Cited by in F6Publishing: 13] [Article Influence: 0.7] [Reference Citation Analysis (0)] |
| 8. | Ryan G, Pandit A, Apatsidis DP. Fabrication methods of porous metals for use in orthopaedic applications. Biomaterials. 2006;27:2651-2670. [PubMed] [DOI] [Cited in This Article: ] [Cited by in Crossref: 1013] [Cited by in F6Publishing: 514] [Article Influence: 28.6] [Reference Citation Analysis (0)] |
| 9. | Johnson T, van Noort R, Stokes CW. Surface analysis of porcelain fused to metal systems. Dent Mater. 2006;22:330-337. [PubMed] [DOI] [Cited in This Article: ] [Cited by in Crossref: 40] [Cited by in F6Publishing: 42] [Article Influence: 2.2] [Reference Citation Analysis (0)] |
| 10. | Egorov VI, Schastlivtsev IV, Prut EV, Baranov AO, Turusov RA. Mechanical properties of the human gastrointestinal tract. J Biomech. 2002;35:1417-1425. [PubMed] [DOI] [Cited in This Article: ] [Cited by in Crossref: 195] [Cited by in F6Publishing: 174] [Article Influence: 7.9] [Reference Citation Analysis (0)] |
| 11. | Gregersen H, Gilja OH, Hausken T, Heimdal A, Gao C, Matre K, Ødegaard S, Berstad A. Mechanical properties in the human gastric antrum using B-mode ultrasonography and antral distension. Am J Physiol Gastrointest Liver Physiol. 2002;283:G368-G375. [PubMed] [Cited in This Article: ] |
| 12. | Distrutti E, Azpiroz F, Soldevilla A, Malagelada JR. Gastric wall tension determines perception of gastric distention. Gastroenterology. 1999;116:1035-1042. [PubMed] [DOI] [Cited in This Article: ] [Cited by in Crossref: 171] [Cited by in F6Publishing: 172] [Article Influence: 6.9] [Reference Citation Analysis (0)] |
| 13. | Kuiken SD, Samsom M, Camilleri M, Mullan BP, Burton DD, Kost LJ, Hardyman TJ, Brinkmann BH, O'Connor MK. Development of a test to measure gastric accommodation in humans. Am J Physiol. 1999;277:G1217-G1221. [PubMed] [Cited in This Article: ] |
| 14. | Huh CH, Bhutani MS, Farfán EB, Bolch WE. Individual variations in mucosa and total wall thickness in the stomach and rectum assessed via endoscopic ultrasound. Physiol Meas. 2003;24:N15-N22. [PubMed] [Cited in This Article: ] |
| 15. | Sarnelli G, Vos R, Cuomo R, Janssens J, Tack J. Reproducibility of gastric barostat studies in healthy controls and in dyspeptic patients. Am J Gastroenterol. 2001;96:1047-1053. [PubMed] [DOI] [Cited in This Article: ] [Cited by in Crossref: 61] [Cited by in F6Publishing: 63] [Article Influence: 2.7] [Reference Citation Analysis (0)] |
| 16. | Mundt MW, Hausken T, Samsom M. Effect of intragastric barostat bag on proximal and distal gastric accommodation in response to liquid meal. Am J Physiol Gastrointest Liver Physiol. 2002;283:G681-G686. [PubMed] [Cited in This Article: ] |
| 17. | Bouras EP, Delgado-Aros S, Camilleri M, Castillo EJ, Burton DD, Thomforde GM, Chial HJ. SPECT imaging of the stomach: comparison with barostat, and effects of sex, age, body mass index, and fundoplication. Single photon emission computed tomography. Gut. 2002;51:781-786. [PubMed] [DOI] [Cited in This Article: ] [Cited by in Crossref: 173] [Cited by in F6Publishing: 177] [Article Influence: 8.0] [Reference Citation Analysis (0)] |
| 18. | De Schepper HU, Cremonini F, Chitkara D, Camilleri M. Assessment of gastric accommodation: overview and evaluation of current methods. Neurogastroenterol Motil. 2004;16:275-285. [PubMed] [DOI] [Cited in This Article: ] [Cited by in Crossref: 97] [Cited by in F6Publishing: 89] [Article Influence: 4.5] [Reference Citation Analysis (0)] |
| 19. | Gilja OH, Lunding J, Hausken T, Gregersen H. Gastric accommodation assessed by ultrasonography. World J Gastroenterol. 2006;12:2825-2829. [PubMed] [Cited in This Article: ] |
| 20. | Lee KJ, Vos R, Janssens J, Tack J. Differences in the sensorimotor response to distension between the proximal and distal stomach in humans. Gut. 2004;53:938-943. [PubMed] [DOI] [Cited in This Article: ] [Cited by in Crossref: 36] [Cited by in F6Publishing: 37] [Article Influence: 1.9] [Reference Citation Analysis (0)] |


