Copyright
©2007 Baishideng Publishing Group Inc.
World J Gastroenterol. Dec 14, 2007; 13(46): 6219-6225
Published online Dec 14, 2007. doi: 10.3748/wjg.v13.i46.6219
Published online Dec 14, 2007. doi: 10.3748/wjg.v13.i46.6219
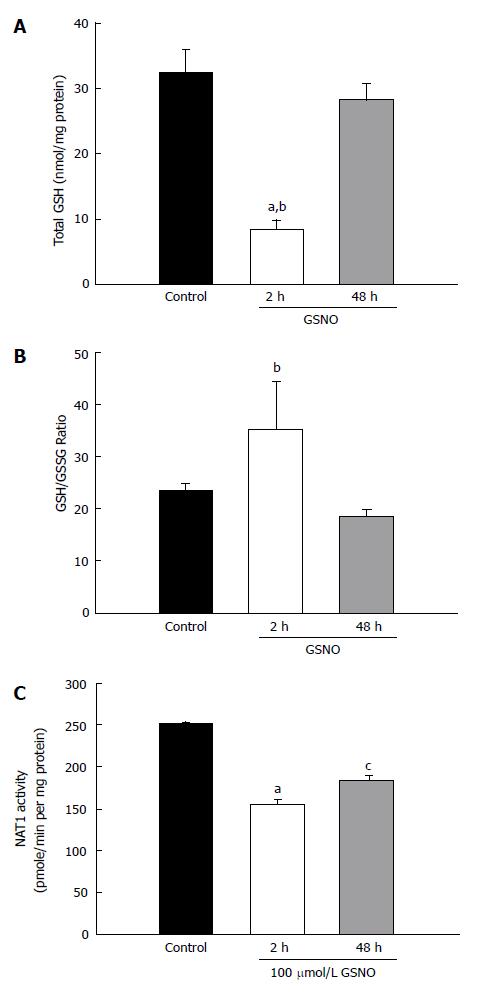
Figure 3 Effect of treatment with the nitric oxide donor GSNO on KKU-100 cells.
Cell cultures were treated with 100 μmol/L GSNO for 2 and 48 h. A: Total GSH in the cells; B: GSH/GSSG ratio; C: Activity of NAT1 PABA-acetylation. Bars represent the mean ± SEM from 3 separate experiments. aP < 0.05 vs control groups, cP < 0.05 vs the 48-h treatment group.
-
Citation: Buranrat B, Prawan A, Sripa B, Kukongviriyapan V. Inflammatory cytokines suppress arylamine
N -acetyltransferase 1 in cholangiocarcinoma cells. World J Gastroenterol 2007; 13(46): 6219-6225 - URL: https://www.wjgnet.com/1007-9327/full/v13/i46/6219.htm
- DOI: https://dx.doi.org/10.3748/wjg.v13.i46.6219


