Copyright
©2007 Baishideng Publishing Group Inc.
World J Gastroenterol. Dec 14, 2007; 13(46): 6197-6202
Published online Dec 14, 2007. doi: 10.3748/wjg.v13.i46.6197
Published online Dec 14, 2007. doi: 10.3748/wjg.v13.i46.6197
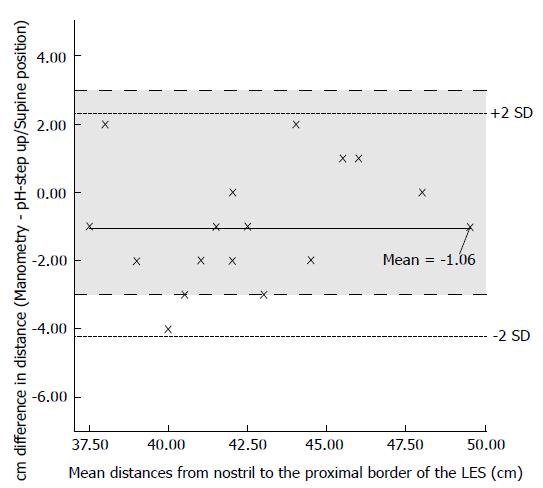
Figure 2 Bland-Altman scatter graph plotted to assess agreement between measurements obtained manometrically and by the pH step-up method with patients in the supine position.
Grey area surrounded by longer dashed line indicates clinically acceptable limits.
- Citation: Can MF, Yagci G, Cetiner S, Gulsen M, Yigit T, Ozturk E, Gorgulu S, Tufan T. Accurate positioning of the 24-hour pH monitoring catheter: Agreement between manometry and pH step-up method in two patient positions. World J Gastroenterol 2007; 13(46): 6197-6202
- URL: https://www.wjgnet.com/1007-9327/full/v13/i46/6197.htm
- DOI: https://dx.doi.org/10.3748/wjg.v13.i46.6197


