Copyright
©2007 Baishideng Publishing Group Inc.
World J Gastroenterol. Jul 14, 2007; 13(26): 3592-3597
Published online Jul 14, 2007. doi: 10.3748/wjg.v13.i26.3592
Published online Jul 14, 2007. doi: 10.3748/wjg.v13.i26.3592
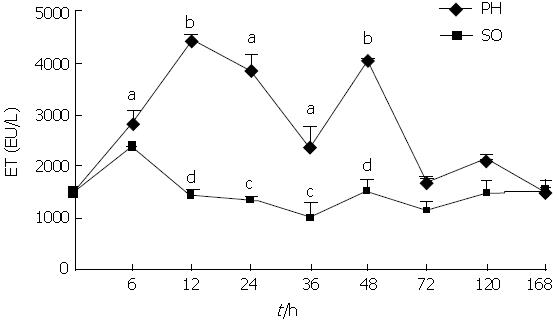
Figure 1 Dynamic changes of serum ET (EU/L) levels.
PH: partial hepatectomy; SO: sham-operation; aP < 0.05, bP < 0.01 compared with 0h group (NC: normal control ); cP < 0.05, dP < 0.01, PH vs SO at corresponding time points.
- Citation: Xu CP, Liu J, Liu JC, Han DW, Zhang Y, Zhao YC. Dynamic changes and mechanism of intestinal endotoxemia in partially hepatectomized rats. World J Gastroenterol 2007; 13(26): 3592-3597
- URL: https://www.wjgnet.com/1007-9327/full/v13/i26/3592.htm
- DOI: https://dx.doi.org/10.3748/wjg.v13.i26.3592


