Copyright
©2007 Baishideng Publishing Group Co.
World J Gastroenterol. May 21, 2007; 13(19): 2727-2732
Published online May 21, 2007. doi: 10.3748/wjg.v13.i19.2727
Published online May 21, 2007. doi: 10.3748/wjg.v13.i19.2727
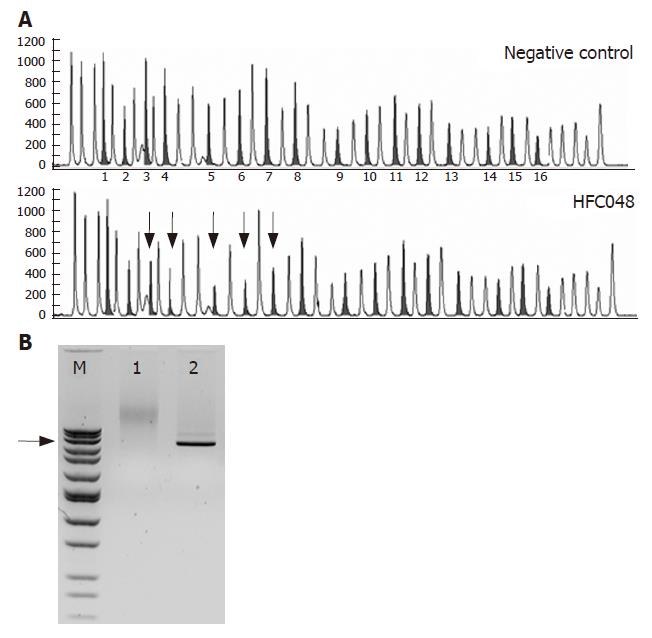
Figure 1 Deletion of MSH2 exons 3-7 in patient HFC048.
A: MLPA chromatogram is shown for a negative control (above) and patient HFC048 (below). The peaks for MSH2 exons are grey, the MLH1 exons and the control peaks are blank. The numbering of MSH2 exons is given between the panels, the exons deleted in patient HFC048 are marked by arrows; B: Long PCR amplification of the deleted region. The sense primer (5'-gctggaaataaggcatccaag-3') is located in exon 2, the antisense primer (5'-aggagtcacaaaaactgccaac-3') in exon 8, approximately 36 kb apart on the MSH2 genomic sequence. Lane "M" contains a molecular weight marker (BenchTop 1kb DNA Ladder, Promega), arrow marking the 6 kb band. Lane 1 shows that amplification from a negative control sample is not successful, while a 6 kb product can be amplified from the positive sample (Lane 2), indicating the presence of a 30 kb deletion.
-
Citation: Papp J, Kovacs ME, Olah E. Germline
MLH1 andMSH2 mutational spectrum including frequent large genomic aberrations in Hungarian hereditary non-polyposis colorectal cancer families: Implications for genetic testing. World J Gastroenterol 2007; 13(19): 2727-2732 - URL: https://www.wjgnet.com/1007-9327/full/v13/i19/2727.htm
- DOI: https://dx.doi.org/10.3748/wjg.v13.i19.2727


