Copyright
©2007 Baishideng Publishing Group Co.
World J Gastroenterol. Mar 14, 2007; 13(10): 1602-1607
Published online Mar 14, 2007. doi: 10.3748/wjg.v13.i10.1602
Published online Mar 14, 2007. doi: 10.3748/wjg.v13.i10.1602
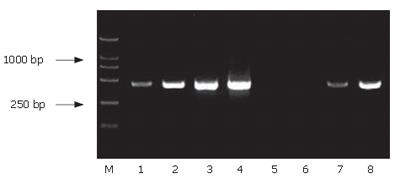
Figure 4 PCR analysis of substraction efficiency.
M: DNA marker 2000; lanes 1-4: PCR of 18, 23, 28, 33 cycles in unsubstracted group, respectively; lanes 5-8: PCR of 18, 23, 28, 33 cycles in substracted group, respectively.
- Citation: Zhang JK, Zhao LF, Cheng J, Guo J, Wang DQ, Hong Y, Mao Y. Screening and cloning for proteins transactivated by the PS1TP5 protein of hepatitis B virus: A suppression subtractive hybridization study. World J Gastroenterol 2007; 13(10): 1602-1607
- URL: https://www.wjgnet.com/1007-9327/full/v13/i10/1602.htm
- DOI: https://dx.doi.org/10.3748/wjg.v13.i10.1602


