Copyright
©2006 Baishideng Publishing Group Co.
World J Gastroenterol. Feb 28, 2006; 12(8): 1243-1248
Published online Feb 28, 2006. doi: 10.3748/wjg.v12.i8.1243
Published online Feb 28, 2006. doi: 10.3748/wjg.v12.i8.1243
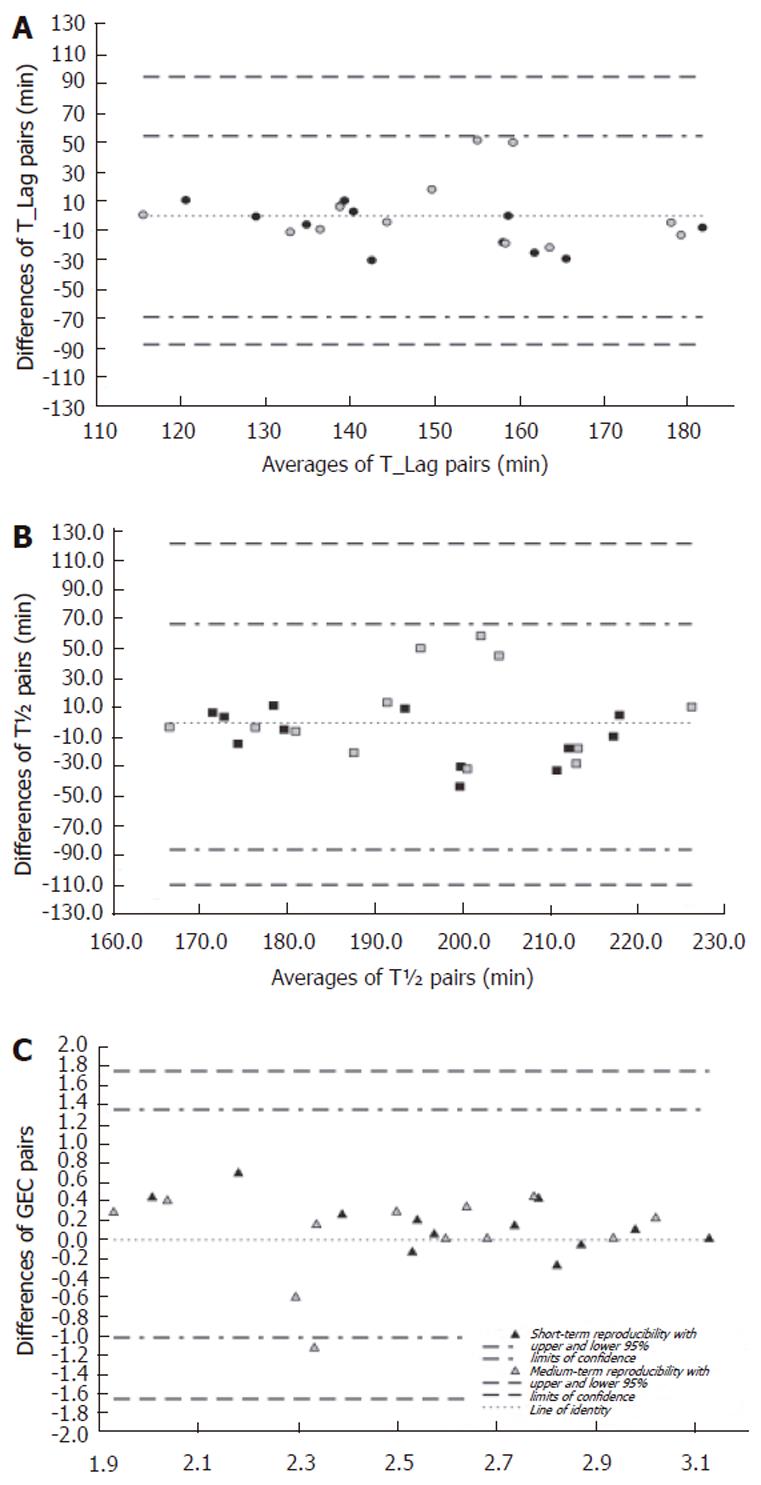
Figure 4 Bland and Altman statistics (plot of differences between pairs vs their names) of the short-(open symbols) and medium-term( filled symbols) reproducibility of the measurement of the lag phase (T-Lag, panel A), the gastric half emptying time (T½ , panel B), and the gastric emptying coefficient (GEC, panel C) of the solid phase gastric emptying with a breath test using 75 mL (68 mg) 13C-octanoic acid and the isotope-selective nondispersive infrared spectrometry.
On each panel the respective borders of the 95% confidence intervals are plotted - cf. the legend of the GEC graph, panel C.
- Citation: Kasicka-Jonderko A, Kamińska M, Jonderko K, Setera O, Błońska-Fajfrowska B. Short- and medium-term reproducibility of gastric emptying of a solid meal determined by a low dose of 13C-octanoic acid and nondispersive isotope-selective infrared spectrometry. World J Gastroenterol 2006; 12(8): 1243-1248
- URL: https://www.wjgnet.com/1007-9327/full/v12/i8/1243.htm
- DOI: https://dx.doi.org/10.3748/wjg.v12.i8.1243


