Copyright
©2006 Baishideng Publishing Group Co.
World J Gastroenterol. Feb 21, 2006; 12(7): 1086-1091
Published online Feb 21, 2006. doi: 10.3748/wjg.v12.i7.1086
Published online Feb 21, 2006. doi: 10.3748/wjg.v12.i7.1086
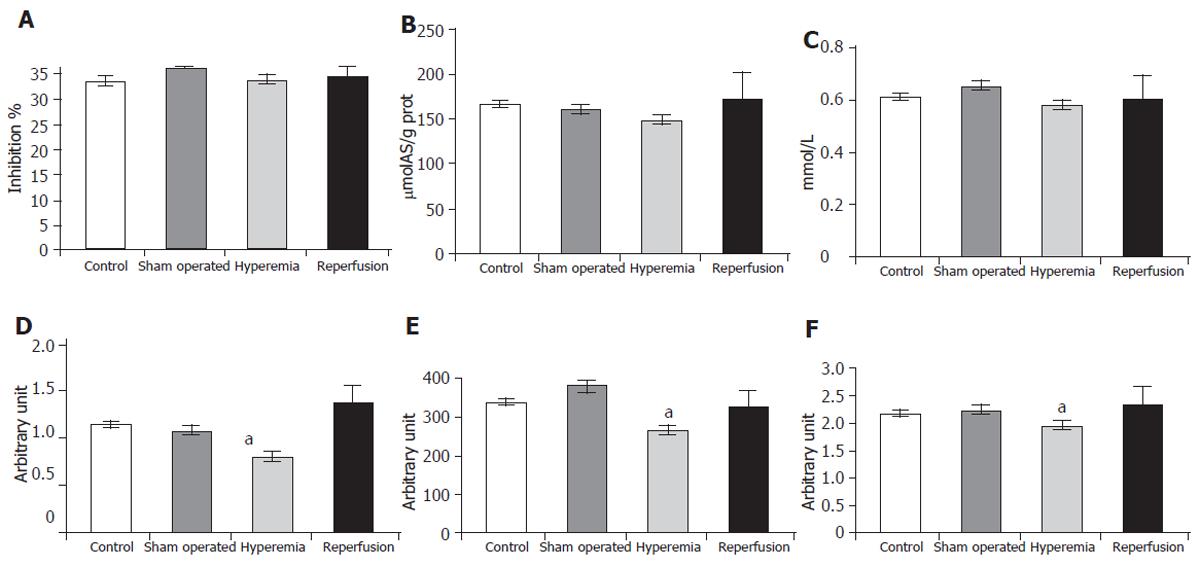
Figure 2 Changes of H-donating ability (A), reducing power (B), concentration of free SH groups (C), SOD activity (D), glutalhione-peroxidase activity (E) and TAS level (F) in different groups.
aP<0.05 vs control group and sham operation group.
- Citation: Váli L, Taba G, Szentmihályi K, Fébel H, Kurucz T, Pallai Z, Kupcsulik P, Blázovics A. Reduced antioxidant level and increased oxidative damage in intact liver lobes during ischaemia-reperfusion. World J Gastroenterol 2006; 12(7): 1086-1091
- URL: https://www.wjgnet.com/1007-9327/full/v12/i7/1086.htm
- DOI: https://dx.doi.org/10.3748/wjg.v12.i7.1086


