Copyright
©2006 Baishideng Publishing Group Co.
World J Gastroenterol. Feb 21, 2006; 12(7): 1018-1024
Published online Feb 21, 2006. doi: 10.3748/wjg.v12.i7.1018
Published online Feb 21, 2006. doi: 10.3748/wjg.v12.i7.1018
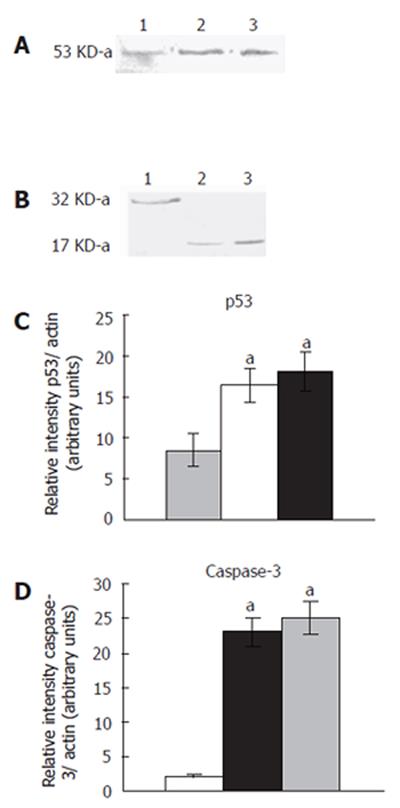
Figure 4 Expression of p53 and caspase-3 proteins.
Western blotting analysis of p53 and caspase-3 in HepG2 cells cultured for 48 h in the presence and absence of T. arjuna extract at the concentration 60 and 100 mg/L was carried out. Cell lysates were prepared as described in MATERIALS AND METHODS, and resolved by 12% SDS-PAGE, immunoblotted and detected using specific antibodies which recognized p53 (A) and caspase-3 (B). Densitometric analysis of the p53 (C) and caspase-3 band (D) was performed. Each value is mean ± SD of three observations. aP < 0.05 represents the statistical significance between control and T. arjuna extract-treated HepG2 cells.
- Citation: Sivalokanathan S, Vijayababu MR, Balasubramanian MP. Effects of Terminalia arjuna bark extract on apoptosis of human hepatoma cell line HepG2. World J Gastroenterol 2006; 12(7): 1018-1024
- URL: https://www.wjgnet.com/1007-9327/full/v12/i7/1018.htm
- DOI: https://dx.doi.org/10.3748/wjg.v12.i7.1018


