Copyright
©2006 Baishideng Publishing Group Co.
World J Gastroenterol. Dec 21, 2006; 12(47): 7635-7641
Published online Dec 21, 2006. doi: 10.3748/wjg.v12.i47.7635
Published online Dec 21, 2006. doi: 10.3748/wjg.v12.i47.7635
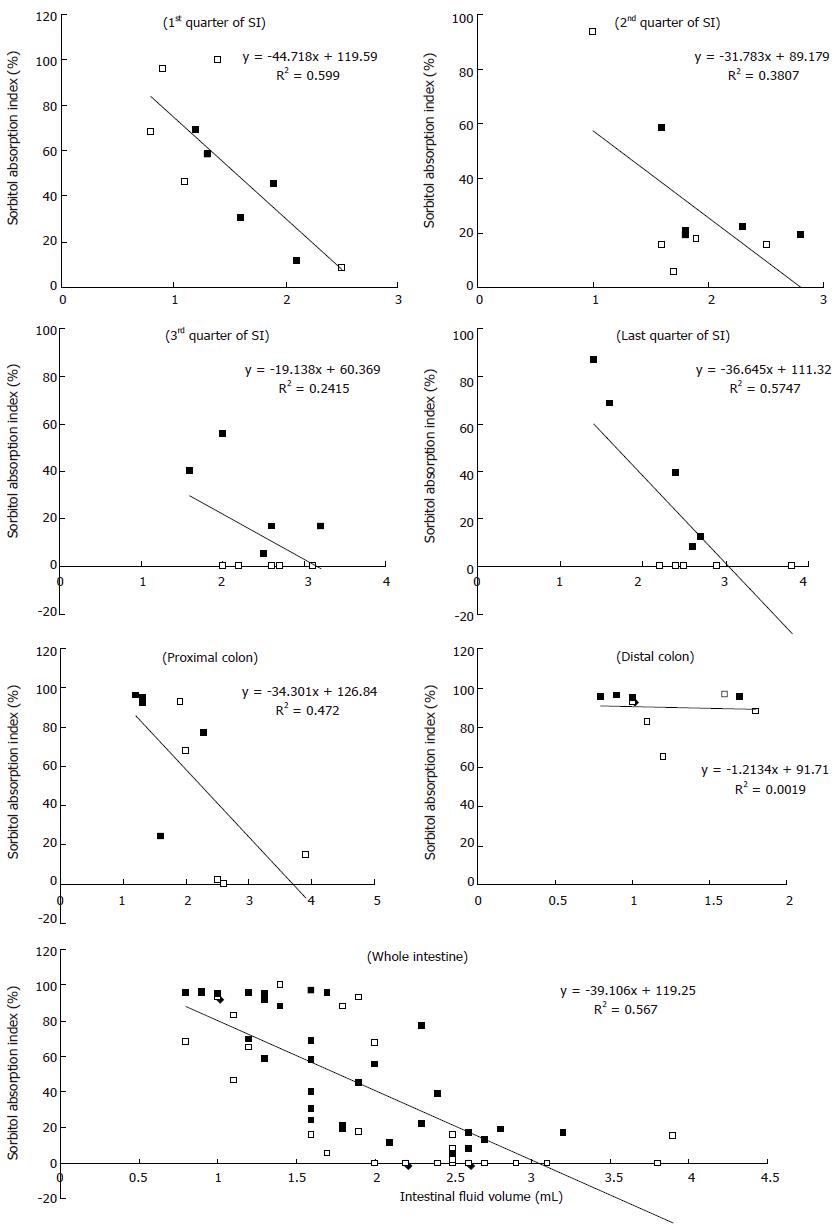
Figure 5 Correlation between the sorbitol absorption index (Y axis) and intestinal fluid volume (X axis) of S (□) and S + RG (■) groups in the different segments of the small intestine (SI), colon, and whole intestine.
The P values indicate significant differences in the 1st quarter (P = 0.0064), 2nd quarter (P = 0.056), last quarter (P = 0.0085) of the small intestine; proximal colon of large intestine (P = 0.0259); and for the whole intestine (P < 0.0001) when S and S + RG groups are compared.
- Citation: Islam MS, Sakaguchi E. Sorbitol-based osmotic diarrhea: Possible causes and mechanism of prevention investigated in rats. World J Gastroenterol 2006; 12(47): 7635-7641
- URL: https://www.wjgnet.com/1007-9327/full/v12/i47/7635.htm
- DOI: https://dx.doi.org/10.3748/wjg.v12.i47.7635


