Copyright
©2006 Baishideng Publishing Group Co.
World J Gastroenterol. Dec 21, 2006; 12(47): 7635-7641
Published online Dec 21, 2006. doi: 10.3748/wjg.v12.i47.7635
Published online Dec 21, 2006. doi: 10.3748/wjg.v12.i47.7635
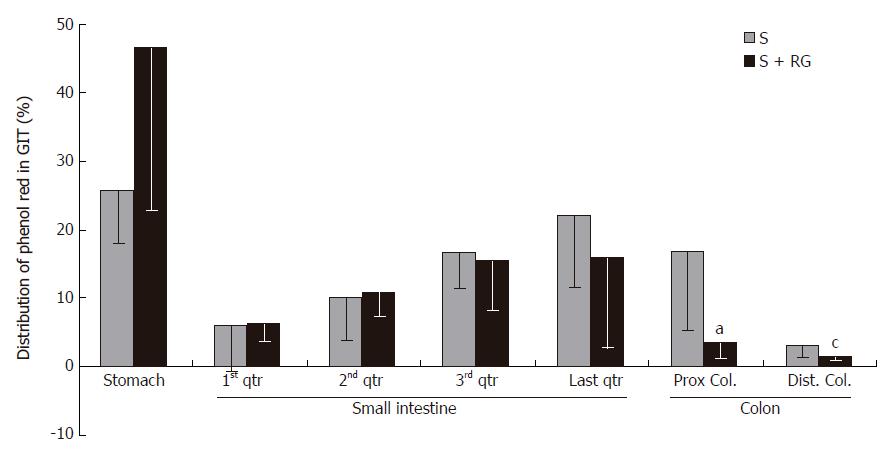
Figure 1 Distribution of marker (phenol red) in the different segments of the gastrointestinal tract 1 h after the dose ingestion.
aP = 0.035, cP = 0.045 vs S group.
- Citation: Islam MS, Sakaguchi E. Sorbitol-based osmotic diarrhea: Possible causes and mechanism of prevention investigated in rats. World J Gastroenterol 2006; 12(47): 7635-7641
- URL: https://www.wjgnet.com/1007-9327/full/v12/i47/7635.htm
- DOI: https://dx.doi.org/10.3748/wjg.v12.i47.7635


