Copyright
©2006 Baishideng Publishing Group Co.
World J Gastroenterol. Nov 14, 2006; 12(42): 6779-6785
Published online Nov 14, 2006. doi: 10.3748/wjg.v12.i42.6779
Published online Nov 14, 2006. doi: 10.3748/wjg.v12.i42.6779
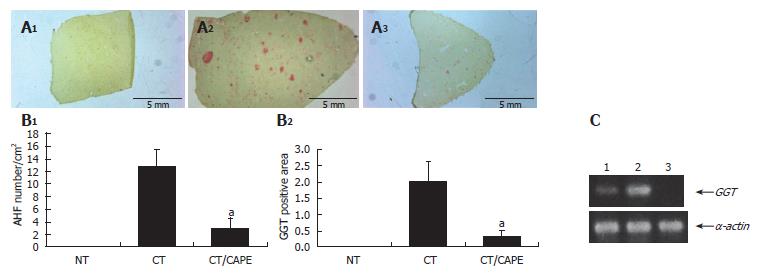
Figure 2 Effect of CAPE on GGT expression.
A: GGT histochemically stained sections (1) non-treated group (NT), (2) carcinogenic treatment group (CT), (3) CT plus CAPE before DEN; B: CAPE effect on number/cm2 of AHF and percentage of GGT+ area/tissue. The differences of AHF number and area after the effect of CAPE in these groups were compared with the respective control group (CT + vehicle) and obtained values were significant by t with aP < 0.05. Twelve histological liver sections per rat from each treatment were randomly selected. NT (n = 3), CT (n = 4), CT plus CAPE (n = 7); C: The RT-PCR assay was used to determine GGT mRNA expression. L1: Control NT; L1: CT group; L1: CT plus CAPE. The series of the extreme right represents α-actin transcripts as control. This experiment was performed with a pool of total RNA isolated from 3 animals.
- Citation: Carrasco-Legleu CE, Sánchez-Pérez Y, Márquez-Rosado L, Fattel-Fazenda S, Arce-Popoca E, Hernández-García S, Villa-Treviño S. A single dose of caffeic acid phenethyl ester prevents initiation in a medium-term rat hepatocarcinogenesis model. World J Gastroenterol 2006; 12(42): 6779-6785
- URL: https://www.wjgnet.com/1007-9327/full/v12/i42/6779.htm
- DOI: https://dx.doi.org/10.3748/wjg.v12.i42.6779


