Copyright
©2006 Baishideng Publishing Group Co.
World J Gastroenterol. Sep 28, 2006; 12(36): 5859-5865
Published online Sep 28, 2006. doi: 10.3748/wjg.v12.i36.5859
Published online Sep 28, 2006. doi: 10.3748/wjg.v12.i36.5859
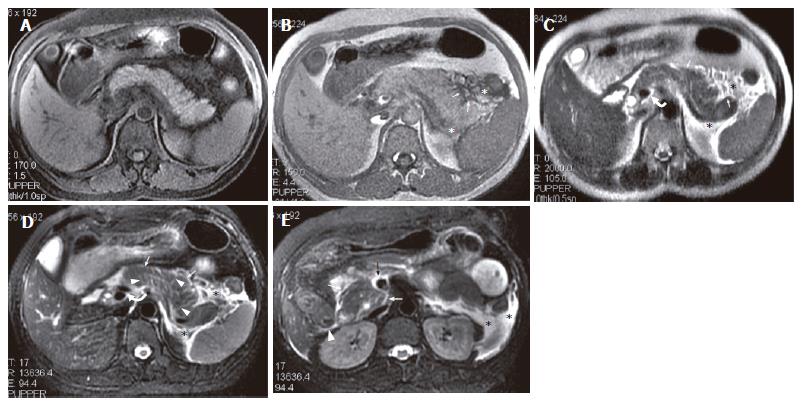
Figure 2 A 28-year-old man with IEP.
A: SPGR fat-suppressed T1-weighted (TR/TE = 170/1.6 ms) image shows normal pancreatic signal intensity; B: pancreatic fascial (arrows) and peripancreatic fat (asterisk) stranding can be seen on GRE in-phase (TR/TE, 150/4.4 ms) image; C: SSFSE T2-weighted (TE = 90 ms) image; D: R-T T2-weighted (TR/TE = 12300/98 ms) image. Perivascular fluid (curve arrow) can be seen on latter two sequences. Thickened pancreatic lobular septum (arrow heads) can only be seen on R-T T2-weighted image (D); E: At the level of the head of the pancreas, R-T T2-weighted image (E) shows pancreatic fascial plane (white arrow), right renal fascia plane (white arrow head), fluid surrounding SMV (black arrow), and left anterior pararenal space and lateroconal plane fluid collections (asterisk).
- Citation: Zhang XM, Feng ZS, Zhao QH, Xiao CM, Mitchell DG, Shu J, Zeng NL, Xu XX, Lei JY, Tian XB. Acute interstitial edematous pancreatitis: Findings on non-enhanced MR imaging. World J Gastroenterol 2006; 12(36): 5859-5865
- URL: https://www.wjgnet.com/1007-9327/full/v12/i36/5859.htm
- DOI: https://dx.doi.org/10.3748/wjg.v12.i36.5859


