Copyright
©2006 Baishideng Publishing Group Co.
World J Gastroenterol. Sep 28, 2006; 12(36): 5834-5845
Published online Sep 28, 2006. doi: 10.3748/wjg.v12.i36.5834
Published online Sep 28, 2006. doi: 10.3748/wjg.v12.i36.5834
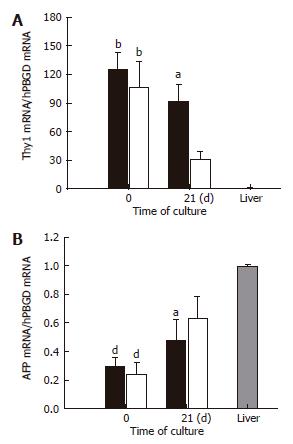
Figure 6 Real-time PCR analysis of the expressions of mRNA for Thy1 and alphafetoprotein in BMSC and ADSC.
The levels of Thy1 (CD90) (A) and the alphafetoprotein (B) expression in differentiated BMSC (black bars) and ADSC (clear bars) were quantified by RT-PCR at the initial and final times of the differentiation protocol, and compared with that of human pooled liver tissue from a liver bank. Data are shown as a fold increase in the mRNA level compared to the liver tissue and normalized by hPBGD. AFP, alphafetoprotein. Data are the mean ± SE of 4 different cultures of BMSC and ADSC. aP < 0.05; bP < 0.01; dP < 0.001.
- Citation: Taléns-Visconti R, Bonora A, Jover R, Mirabet V, Carbonell F, Castell JV, Gómez-Lechón MJ. Hepatogenic differentiation of human mesenchymal stem cells from adipose tissue in comparison with bone marrow mesenchymal stem cells. World J Gastroenterol 2006; 12(36): 5834-5845
- URL: https://www.wjgnet.com/1007-9327/full/v12/i36/5834.htm
- DOI: https://dx.doi.org/10.3748/wjg.v12.i36.5834


