Copyright
©2006 Baishideng Publishing Group Co.
World J Gastroenterol. Aug 21, 2006; 12(31): 4996-5004
Published online Aug 21, 2006. doi: 10.3748/wjg.v12.i31.4996
Published online Aug 21, 2006. doi: 10.3748/wjg.v12.i31.4996
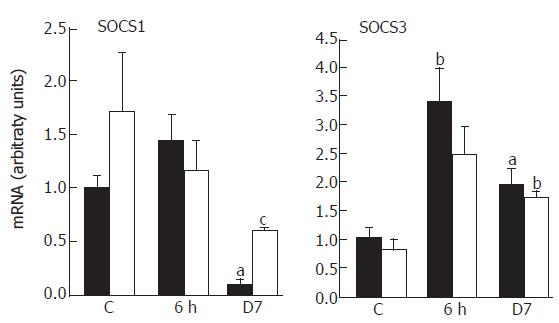
Figure 4 Expression of the regulator cytokine gene SOCS1 and SOCS3 after irradiation in rats.
(■): CAPE-untreated; (□): CAPE-treated (mean ± SEM, n = 6); aP < 0.05, bP < 0.01 vs control; cP < 0.05, dP < 0.01 vs untreated.
- Citation: Grémy O, Benderitter M, Linard C. Caffeic acid phenethyl ester modifies the Th1/Th2 balance in ileal mucosa after γ-irradiation in the rat by modulating the cytokine pattern. World J Gastroenterol 2006; 12(31): 4996-5004
- URL: https://www.wjgnet.com/1007-9327/full/v12/i31/4996.htm
- DOI: https://dx.doi.org/10.3748/wjg.v12.i31.4996


