Copyright
©2006 Baishideng Publishing Group Co.
World J Gastroenterol. Jul 28, 2006; 12(28): 4517-4523
Published online Jul 28, 2006. doi: 10.3748/wjg.v12.i28.4517
Published online Jul 28, 2006. doi: 10.3748/wjg.v12.i28.4517
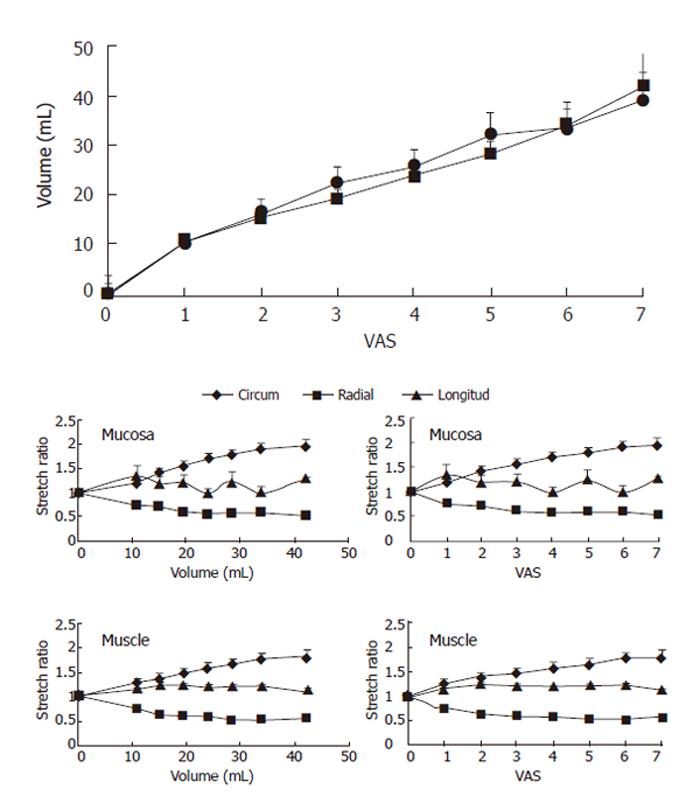
Figure 3 Illustration of the relation between volume and sensory intensity on the visual analogue scale (VAS) with 5 as the pain threshold (top graph).
Since there was no difference in the curves obtained (triangles) before and during (squares) infusion of butylscopolamine, data obtained during butylscopolamine are given in this paper. The four figures show the circumferential, radial and longitudinal stretch ratios as function of volume and VAS in the mucosa and muscle layers (the circumferential data are from the mucosal surface and the outer muscle surface).
- Citation: Larsen E, Reddy H, Drewes AM, Arendt-Nielsen L, Gregersen H. Ultrasonographic study of mechanosensory properties in human esophagus during mechanical distension. World J Gastroenterol 2006; 12(28): 4517-4523
- URL: https://www.wjgnet.com/1007-9327/full/v12/i28/4517.htm
- DOI: https://dx.doi.org/10.3748/wjg.v12.i28.4517


