Copyright
©2006 Baishideng Publishing Group Co.
World J Gastroenterol. Jul 28, 2006; 12(28): 4478-4484
Published online Jul 28, 2006. doi: 10.3748/wjg.v12.i28.4478
Published online Jul 28, 2006. doi: 10.3748/wjg.v12.i28.4478
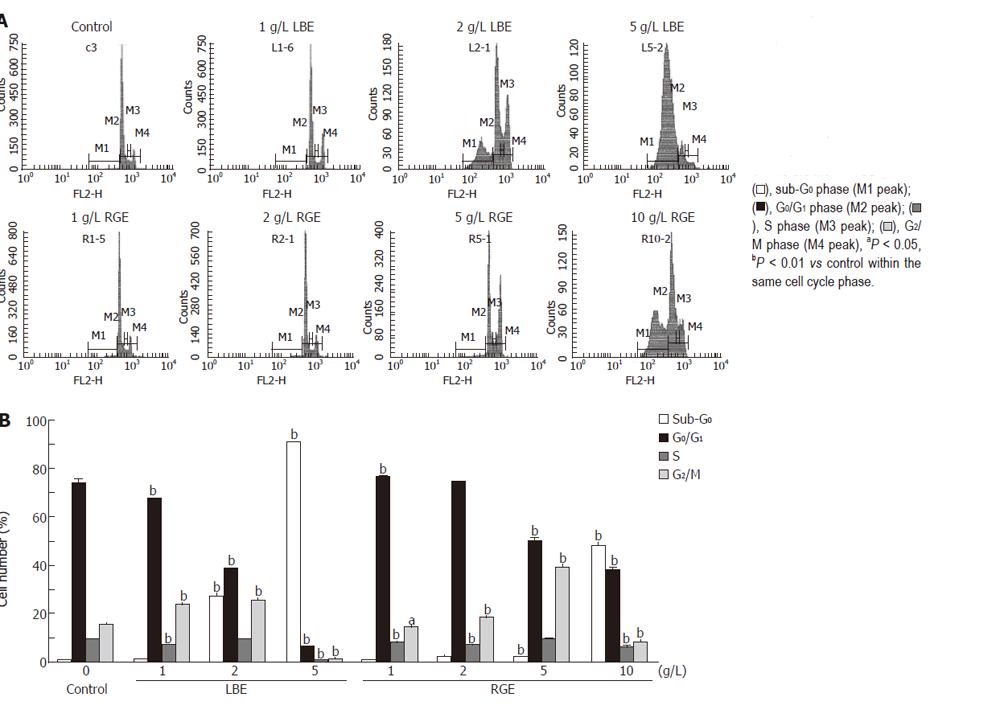
Figure 1 Representative DNA histograms (A) and percentage of cells in different cell cycle phases (B) after incubated with various concentrations of hot water-extracted LBE and RGE for 24 h in rat H-4-II-E cells determined by flow cytometry.
Values are mean ± SD (n = 6).
-
Citation: Chao JCJ, Chiang SW, Wang CC, Tsai YH, Wu MS. Hot water-extracted
Lycium barbarum andRehmannia glutinosa inhibit proliferation and induce apoptosis of hepatocellular carcinoma cells. World J Gastroenterol 2006; 12(28): 4478-4484 - URL: https://www.wjgnet.com/1007-9327/full/v12/i28/4478.htm
- DOI: https://dx.doi.org/10.3748/wjg.v12.i28.4478


