Copyright
©2006 Baishideng Publishing Group Co.
World J Gastroenterol. Jul 21, 2006; 12(27): 4318-4324
Published online Jul 21, 2006. doi: 10.3748/wjg.v12.i27.4318
Published online Jul 21, 2006. doi: 10.3748/wjg.v12.i27.4318
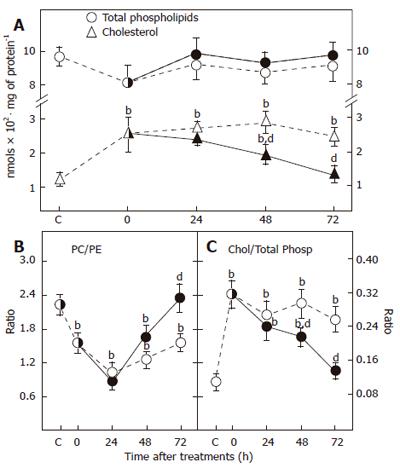
Figure 2 Total phospholipids and cholesterol in plasma membranes of mucilage-treated rats with gastritis (A) and the phosphatidylcholine (PC)/phosphatidylethanolamine (PE) methylation ratio (B) and cholesterol (chol)/total phospholipids (total phosp) ratio (C).
In all cases mean ± SE, n = 5. Animals subjected to gastritis are represented by empty symbols while those treated with mucilage are represented by solid symbols. bP < 0.01 vs healthy animal control. dP < 0.01 vs animals with gastritis not treated with mucilage.
-
Citation: Vázquez-Ramírez R, Olguín-Martínez M, Kubli-Garfias C, Hernández-Muñoz R. Reversing gastric mucosal alterations during ethanol-induced chronic gastritis in rats by oral administration of
Opuntia ficus-indica mucilage. World J Gastroenterol 2006; 12(27): 4318-4324 - URL: https://www.wjgnet.com/1007-9327/full/v12/i27/4318.htm
- DOI: https://dx.doi.org/10.3748/wjg.v12.i27.4318


