Copyright
©2006 Baishideng Publishing Group Co.
World J Gastroenterol. Jun 21, 2006; 12(23): 3716-3721
Published online Jun 21, 2006. doi: 10.3748/wjg.v12.i23.3716
Published online Jun 21, 2006. doi: 10.3748/wjg.v12.i23.3716
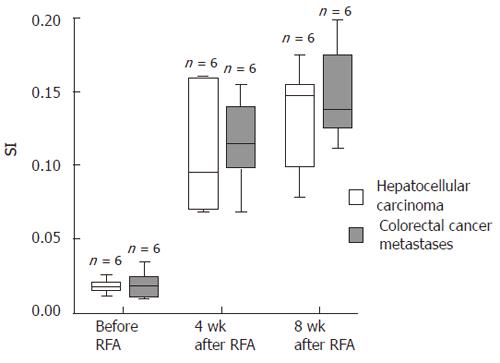
Figure 2 Stimulation indices of CD4+ T cells.
The Box-Whisker-plots show the ratio of IFNγ secretion of stimulated vs unstimulated CD4+ T cells as determined by a cytokine secretion and capture assay before, 4 and 8 wk after RFA. White boxes represent the patients with HCC and grey boxes the patients with colorectal cancer metastases. Outlayers are marked with o, extremes with *. For significances refer to table 1.
- Citation: Hänsler J, Wissniowski TT, Schuppan D, Witte A, Bernatik T, Hahn EG, Strobel D. Activation and dramatically increased cytolytic activity of tumor specific T lymphocytes after radio-frequency ablation in patients with hepatocellular carcinoma and colorectal liver metastases. World J Gastroenterol 2006; 12(23): 3716-3721
- URL: https://www.wjgnet.com/1007-9327/full/v12/i23/3716.htm
- DOI: https://dx.doi.org/10.3748/wjg.v12.i23.3716


