Copyright
©2006 Baishideng Publishing Group Co.
World J Gastroenterol. Jun 7, 2006; 12(21): 3386-3392
Published online Jun 7, 2006. doi: 10.3748/wjg.v12.i21.3386
Published online Jun 7, 2006. doi: 10.3748/wjg.v12.i21.3386
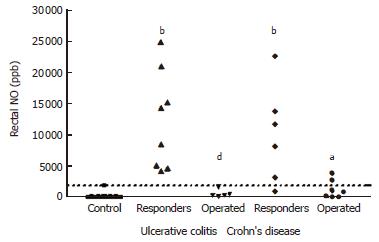
Figure 2 Rectal NO levels in the treatment of UC and CD patients on d 1.
bP < 0.001 vs Control; dP < 0.01, aP < 0.05 vs patients responding to treatment.
-
Citation: Ljung T, Lundberg S, Varsanyi M, Johansson C, Schmidt PT, Herulf M, Lundberg JO, Hellström PM. Rectal nitric oxide as biomarker in the treatment of inflammatory bowel disease: Responders
versus nonresponders. World J Gastroenterol 2006; 12(21): 3386-3392 - URL: https://www.wjgnet.com/1007-9327/full/v12/i21/3386.htm
- DOI: https://dx.doi.org/10.3748/wjg.v12.i21.3386


