Copyright
©2006 Baishideng Publishing Group Co.
World J Gastroenterol. May 14, 2006; 12(18): 2846-2857
Published online May 14, 2006. doi: 10.3748/wjg.v12.i18.2846
Published online May 14, 2006. doi: 10.3748/wjg.v12.i18.2846
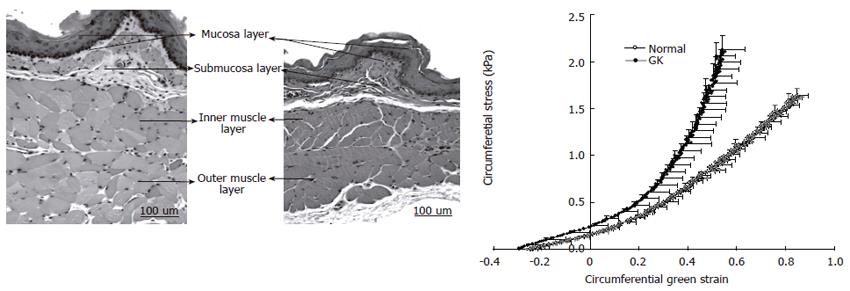
Figure 2 Microphotos of esophageal layer thickness in GK rats (left) and normal rats (middle).
The muscle layer was biggest in the GK esophagus. Correspondingly the circumferential stress-strain curves of diabetic and non-diabetic esophageal wall showed in the right. The curve in the GK rats was shifted to the left, indicating that the esophageal wall stiffness increased.
- Citation: Zhao JB, Frøkjær JB, Drewes AM, Ejskjaer N. Upper gastrointestinal sensory-motor dysfunction in diabetes mellitus. World J Gastroenterol 2006; 12(18): 2846-2857
- URL: https://www.wjgnet.com/1007-9327/full/v12/i18/2846.htm
- DOI: https://dx.doi.org/10.3748/wjg.v12.i18.2846


