
















©2006 Baishideng Publishing Group Co.
World J Gastroenterol. Mar 28, 2006; 12(12): 1905-1911
Published online Mar 28, 2006. doi: 10.3748/wjg.v12.i12.1905
Published online Mar 28, 2006. doi: 10.3748/wjg.v12.i12.1905
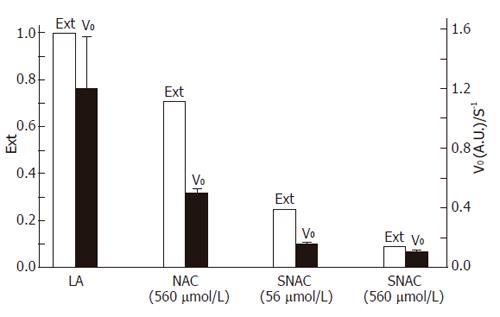
Figure 5 Barr graph showing the extent (Ext) and initial rates (V0) of the peroxidation reaction of linoleic acid (LA) by SLO.
Data were extracted from the curves of Figure 4.
- Citation: Oliveira CP, Simplicio FI, Lima VM, Yuahasi K, Lopasso FP, Alves VA, Abdalla DS, Carrilho FJ, Laurindo FR, Oliveira MG. Oral administration of S-nitroso-N-acetylcysteine prevents the onset of non alcoholic fatty liver disease in rats. World J Gastroenterol 2006; 12(12): 1905-1911
- URL: https://www.wjgnet.com/1007-9327/full/v12/i12/1905.htm
- DOI: https://dx.doi.org/10.3748/wjg.v12.i12.1905