Copyright
©2005 Baishideng Publishing Group Inc.
World J Gastroenterol. Mar 7, 2005; 11(9): 1283-1286
Published online Mar 7, 2005. doi: 10.3748/wjg.v11.i9.1283
Published online Mar 7, 2005. doi: 10.3748/wjg.v11.i9.1283
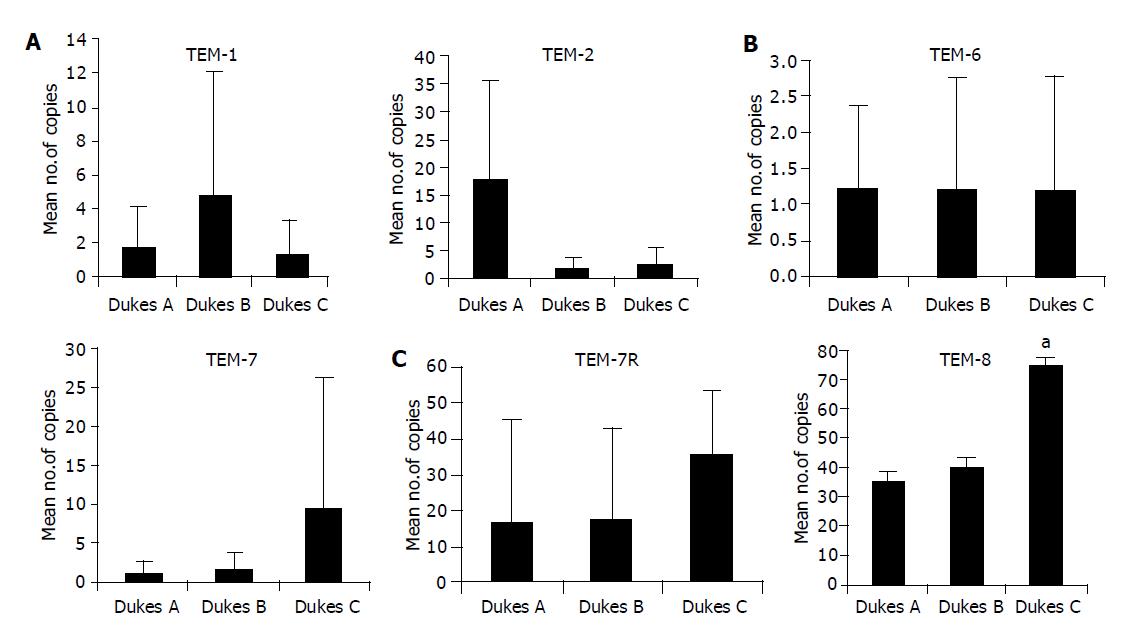
Figure 2 Real-time quantitative RT-PCR.
Shown in the figure are Mean copies/ng mRNA. Levels of expression of TEMs in colon tissues in tumors with different in different Dukes stages. The number of transcripts of TEM-1 is high in Dukes A and TEM-2 higher in Dukes B tumors. TEM-6 shows no difference in all three stages (Dukes A, B and C). Dukes C tumor expressed greatest level of TEM-8 (aP = 0.001 vs Dukes A). Both TEM-7 and -7R shows higher level of expression in Dukes C, however the difference is not significant (P>0.05).
- Citation: Rmali K, Puntis M, Jiang W. Prognostic values of tumor endothelial markers in patients with colorectal cancer. World J Gastroenterol 2005; 11(9): 1283-1286
- URL: https://www.wjgnet.com/1007-9327/full/v11/i9/1283.htm
- DOI: https://dx.doi.org/10.3748/wjg.v11.i9.1283


