Copyright
©2005 Baishideng Publishing Group Inc.
World J Gastroenterol. Dec 21, 2005; 11(47): 7480-7485
Published online Dec 21, 2005. doi: 10.3748/wjg.v11.i47.7480
Published online Dec 21, 2005. doi: 10.3748/wjg.v11.i47.7480
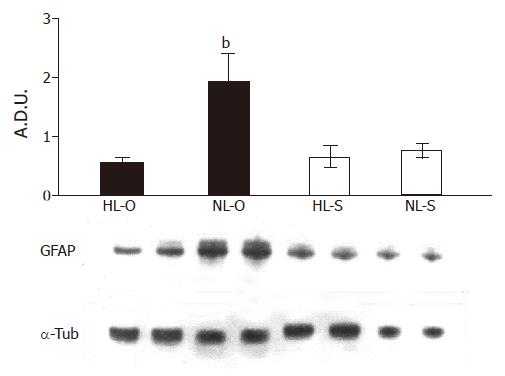
Figure 5 Western blot analysis of GFAP expression.
Top panel: densitometric quantification of GFAP in the high-fat-induced steatotic liver (HL-O and HL-S), and after its treatment with a normal-lipidic diet (NL-O, NL-S). Results were average values of four experimental animals in each group. HL-O, high-lipidic olive oil; NL-O, normal-lipidic olive oil; HL-S, high-lipidic sunflower oil; NL-S, normal-lipidic sunflower oil. Bottom panel: representative autoradiography of the corresponding GFAP band. α-Tubulin immunodetection was also included as a protein-loading control. Protein expression is significantly greater than in HL-O group (bP<0.001).
- Citation: Hernández R, Martínez-Lara E, Cañuelo A, Moral MLD, Blanco S, Siles E, Jiménez A, Pedrosa J&, Peinado M. Steatosis recovery after treatment with a balanced sunflower or olive oil-based diet: Involvement of perisinusoidal stellate cells. World J Gastroenterol 2005; 11(47): 7480-7485
- URL: https://www.wjgnet.com/1007-9327/full/v11/i47/7480.htm
- DOI: https://dx.doi.org/10.3748/wjg.v11.i47.7480


