Copyright
©2005 Baishideng Publishing Group Inc.
World J Gastroenterol. Nov 7, 2005; 11(41): 6495-6502
Published online Nov 7, 2005. doi: 10.3748/wjg.v11.i41.6495
Published online Nov 7, 2005. doi: 10.3748/wjg.v11.i41.6495
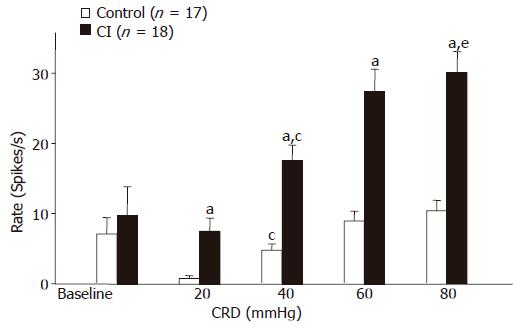
Figure 1 Average responses of LS neurons to CRD (20, 40, 60, 80 mmHg).
Bar graph summarizes the average background activity (baseline; control, n = 17; CI, n = 18) and the responses of LS neurons to all intensities of CRD in control and CI rats. The responses to CRD are reported as the mean increase in firing rate above baseline. Responses recorded in CI rats were significantly higher than those recorded in control rats. aP<0.05 vs the values of normal rats with the same intensity; cP<0.05 vs 20 mmHg CRD in each group; eP<0.05 vs 40mmHg CRD in CI rats.
- Citation: Lin C, Al-Chaer ED. Differential effects of glutamate receptor antagonists on dorsal horn neurons responding to colorectal distension in a neonatal colon irritation rat model. World J Gastroenterol 2005; 11(41): 6495-6502
- URL: https://www.wjgnet.com/1007-9327/full/v11/i41/6495.htm
- DOI: https://dx.doi.org/10.3748/wjg.v11.i41.6495


