Copyright
©The Author(s) 2005.
World J Gastroenterol. Oct 7, 2005; 11(37): 5795-5800
Published online Oct 7, 2005. doi: 10.3748/wjg.v11.i37.5795
Published online Oct 7, 2005. doi: 10.3748/wjg.v11.i37.5795
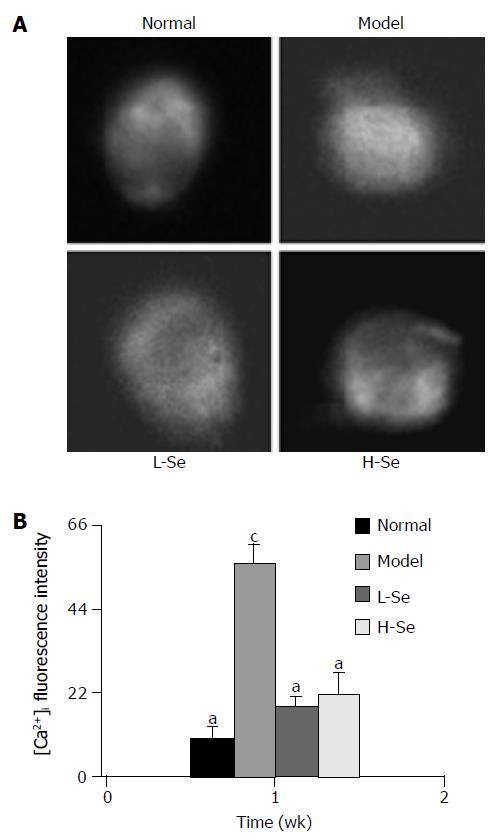
Figure 3 [Ca2+]i fluorescence visualizations (A) and intensities (B) in mice with hepatic injury after Se-enriched lactobacillus treatment.
aP < 0.05 vs model group; cP < 0.05 vs normal group.
- Citation: Chen L, Pan DD, Zhou J, Jiang YZ. Protective effect of selenium-enriched lactobacillus on CCl4-induced liver injury in mice and its possible mechanisms. World J Gastroenterol 2005; 11(37): 5795-5800
- URL: https://www.wjgnet.com/1007-9327/full/v11/i37/5795.htm
- DOI: https://dx.doi.org/10.3748/wjg.v11.i37.5795


