Copyright
©The Author(s) 2005.
World J Gastroenterol. Sep 14, 2005; 11(34): 5327-5331
Published online Sep 14, 2005. doi: 10.3748/wjg.v11.i34.5327
Published online Sep 14, 2005. doi: 10.3748/wjg.v11.i34.5327
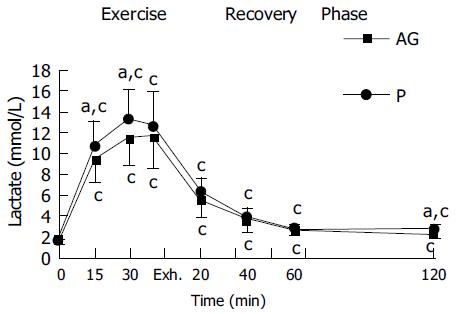
Figure 3 Plasma lactate levels observed during exercise and recovery phases in group AG (—■—) and group P (—●—).
Each point represents the mean±SD (n = 13). aP < 0.05 vs P groups; cP < 0.05 vs before exercise.
- Citation: Hsu CC, Ho MC, Lin LC, Su B, Hsu MC. American ginseng supplementation attenuates creatine kinase level induced by submaximal exercise in human beings. World J Gastroenterol 2005; 11(34): 5327-5331
- URL: https://www.wjgnet.com/1007-9327/full/v11/i34/5327.htm
- DOI: https://dx.doi.org/10.3748/wjg.v11.i34.5327


