Copyright
©The Author(s) 2005.
World J Gastroenterol. Sep 7, 2005; 11(33): 5123-5128
Published online Sep 7, 2005. doi: 10.3748/wjg.v11.i33.5123
Published online Sep 7, 2005. doi: 10.3748/wjg.v11.i33.5123
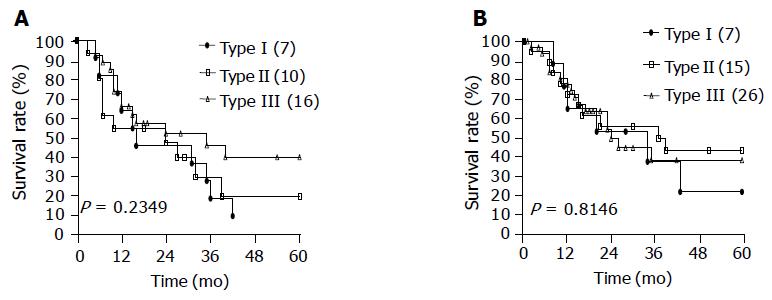
Figure 3 Survival curves according to Siewert’s classification in the elderly (A) and in the younger group (B).
In both groups the worst survival rate regarding type I. Group A: ≥70 years old; group B: ≤60 years old. Kaplan-Meier and log-rank test.
- Citation: Martino ND, Izzo G, Cosenza A, Cerullo G, Torelli F, Brillantino A, Genio AD. Adenocarcinoma of gastric cardia in the elderly: Surgical problems and prognostic factors. World J Gastroenterol 2005; 11(33): 5123-5128
- URL: https://www.wjgnet.com/1007-9327/full/v11/i33/5123.htm
- DOI: https://dx.doi.org/10.3748/wjg.v11.i33.5123


