Copyright
©The Author(s) 2005.
World J Gastroenterol. Aug 7, 2005; 11(29): 4530-4535
Published online Aug 7, 2005. doi: 10.3748/wjg.v11.i29.4530
Published online Aug 7, 2005. doi: 10.3748/wjg.v11.i29.4530
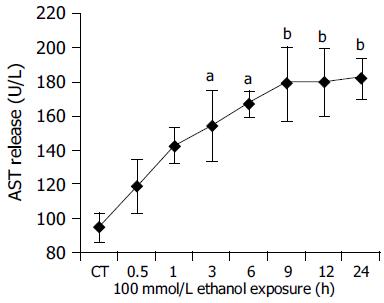
Figure 5 Time course experiments for AST release after ethanol 100 mmol/L exposure between 0.
5 and 24 h. CT: control; aP<0.05, bP<0.01 vs untreated control cultures. Each point represents the mean±SD of triplicates of five independent experiments.
- Citation: Liu LG, Yan H, Yao P, Zhang W, Zou LJ, Song FF, Li K, Sun XF. CYP2E1-dependent hepatotoxicity and oxidative damage after ethanol administration in human primary hepatocytes. World J Gastroenterol 2005; 11(29): 4530-4535
- URL: https://www.wjgnet.com/1007-9327/full/v11/i29/4530.htm
- DOI: https://dx.doi.org/10.3748/wjg.v11.i29.4530


