Copyright
©2005 Baishideng Publishing Group Inc.
World J Gastroenterol. Jun 28, 2005; 11(24): 3701-3709
Published online Jun 28, 2005. doi: 10.3748/wjg.v11.i24.3701
Published online Jun 28, 2005. doi: 10.3748/wjg.v11.i24.3701
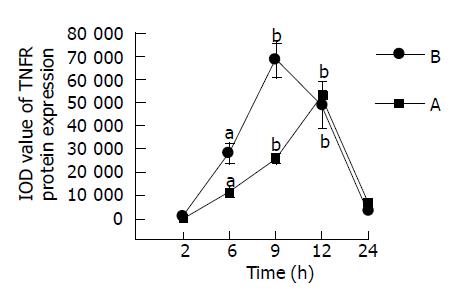
Figure 8 IOD level of TNFR1 in mice at different time points after GalN/LPS treatment.
A: large intestinal tissues. B: small intestinal tissues. aP<0.05; bP <0.01 vs 2 h time point.
- Citation: Song HL, Lu S, Liu P. Tumor necrosis factor-alpha induces apoptosis of enterocytes in mice with fulminant hepatic failure. World J Gastroenterol 2005; 11(24): 3701-3709
- URL: https://www.wjgnet.com/1007-9327/full/v11/i24/3701.htm
- DOI: https://dx.doi.org/10.3748/wjg.v11.i24.3701


