Copyright
©2005 Baishideng Publishing Group Inc.
World J Gastroenterol. Jun 14, 2005; 11(22): 3431-3440
Published online Jun 14, 2005. doi: 10.3748/wjg.v11.i22.3431
Published online Jun 14, 2005. doi: 10.3748/wjg.v11.i22.3431
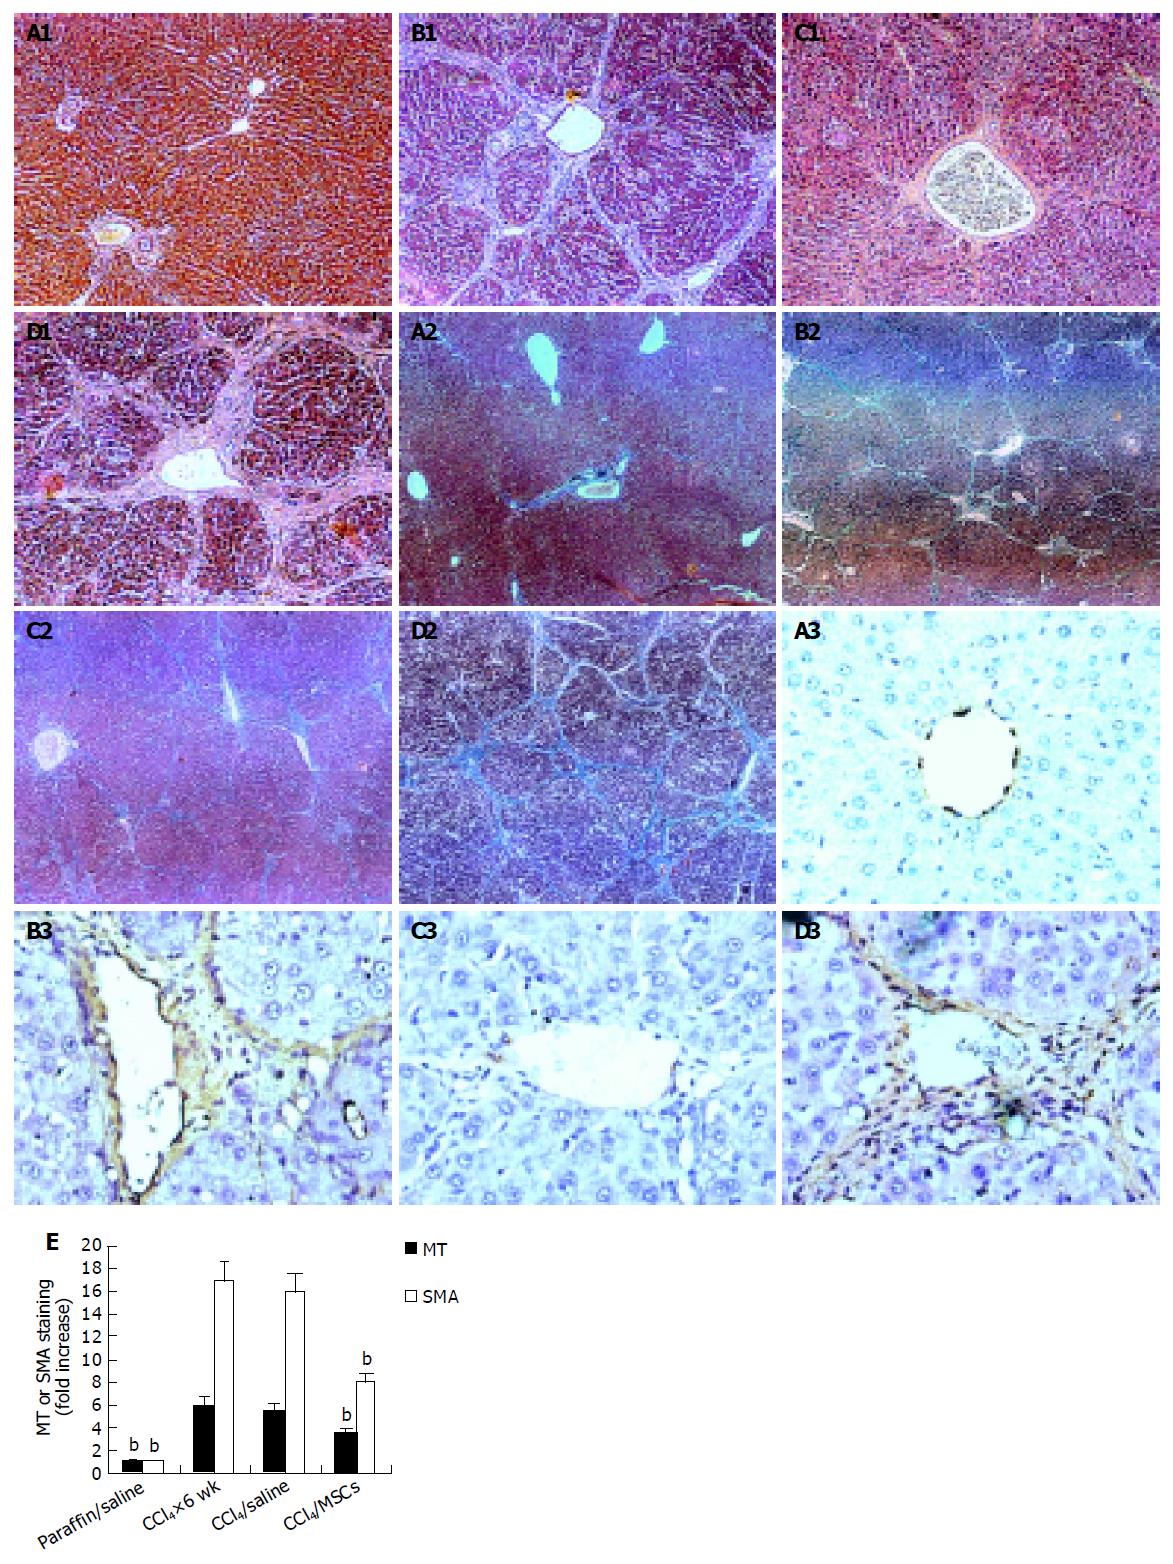
Figure 3 Analysis of liver histopathology and immunohistochemistry in rats induced with CCl4.
A: Paraffin/saline; B: CCl4×6 wk; C: CCl4/MSCs; D: CCl4/saline; 1: HE staining, original magnification ×100; 2: MT staining, original magnification ×40; 3: immunohistochemistry for α-SMA, DAB staining, original magnification ×400; E: MT and α-SMA staining was quantified using IBAS 2.5 software. Data represent the fold-increase in positive staining vs paraffin/saline. Values are presented as mean±SD. bP<0.01 vs CCl4/saline. Not significantly different between values of CCl4/saline and CCl4×6 wk.
- Citation: Zhao DC, Lei JX, Chen R, Yu WH, Zhang XM, Li SN, Xiang P. Bone marrow-derived mesenchymal stem cells protect against experimental liver fibrosis in rats. World J Gastroenterol 2005; 11(22): 3431-3440
- URL: https://www.wjgnet.com/1007-9327/full/v11/i22/3431.htm
- DOI: https://dx.doi.org/10.3748/wjg.v11.i22.3431


