Copyright
©2005 Baishideng Publishing Group Inc.
World J Gastroenterol. May 21, 2005; 11(19): 2900-2905
Published online May 21, 2005. doi: 10.3748/wjg.v11.i19.2900
Published online May 21, 2005. doi: 10.3748/wjg.v11.i19.2900
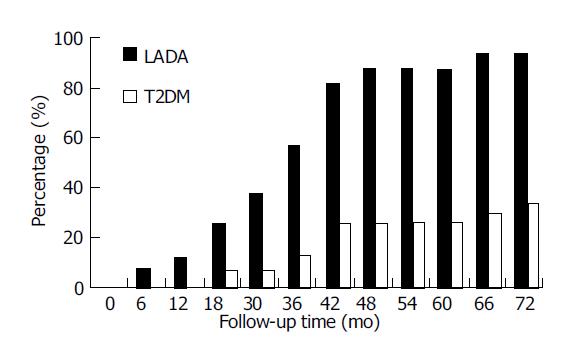
Figure 2 The percentage of patients whose FCP decreased more than 50% compared with the baseline during the follow-up time.
Black bar graph representing the percentage of LADA patients, which showed us a much quicker increase from 6.25% at 6th mo to 25.0% at 18th mo until 93.8% at 72th mo. Meanwhile in the white bar of T2DM group, the percentage increased much slower and only to 30.0% at the end of follow-up.
- Citation: Yang L, Zhou ZG, Huang G, Ouyang LL, Li X, Yan X. Six-year follow-up of pancreatic β cell function in adults with latent autoimmune diabetes. World J Gastroenterol 2005; 11(19): 2900-2905
- URL: https://www.wjgnet.com/1007-9327/full/v11/i19/2900.htm
- DOI: https://dx.doi.org/10.3748/wjg.v11.i19.2900


