Copyright
©2005 Baishideng Publishing Group Inc.
World J Gastroenterol. May 21, 2005; 11(19): 2900-2905
Published online May 21, 2005. doi: 10.3748/wjg.v11.i19.2900
Published online May 21, 2005. doi: 10.3748/wjg.v11.i19.2900
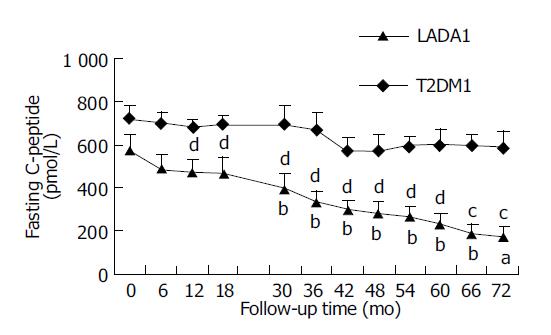
Figure 1 Changes of FCP level in LADA1 and T2DM1 patients during the 6-year follow-up time.
Values are mean±SE of 16 patients respectively. The lower line shown here is representative of LADA patients and the upper one of T2DM group’s. The FCP of LADA1, decreasing much quicker than that of T2DM1 patients, declined significantly from the 30th mo compared with the entry (aP<0.05, bP<0.01). And from the 12th mo, the difference of FCP between LADA1 and T2DM1 patients became significant until the end of follow-up time (cP<0.05, dP<0.01). Meanwhile T2DM1 group did not show any significant decrease during the follow-up period (P>0.05).
- Citation: Yang L, Zhou ZG, Huang G, Ouyang LL, Li X, Yan X. Six-year follow-up of pancreatic β cell function in adults with latent autoimmune diabetes. World J Gastroenterol 2005; 11(19): 2900-2905
- URL: https://www.wjgnet.com/1007-9327/full/v11/i19/2900.htm
- DOI: https://dx.doi.org/10.3748/wjg.v11.i19.2900


