Copyright
©2005 Baishideng Publishing Group Inc.
World J Gastroenterol. May 7, 2005; 11(17): 2634-2636
Published online May 7, 2005. doi: 10.3748/wjg.v11.i17.2634
Published online May 7, 2005. doi: 10.3748/wjg.v11.i17.2634
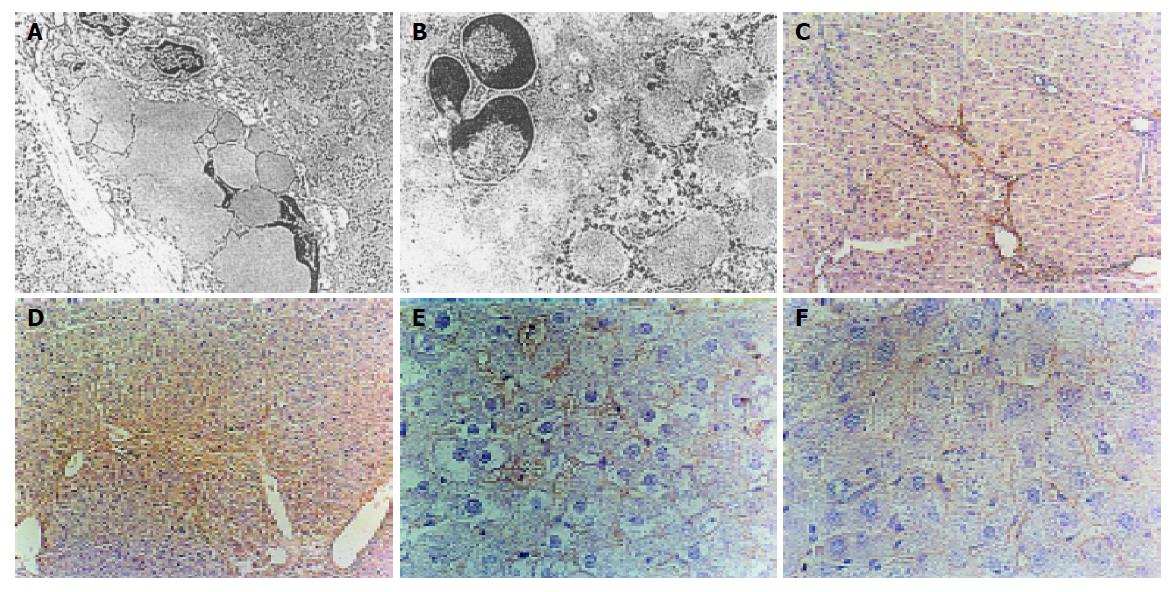
Figure 1 Ultrastructure change, expression of TGF-β1 and α-SMA in model group and IFN-α preventing group respectively.
A: Collagen fibers and activated HSC in Disse space in model group. EM×4000; B: The number of activated HSCs and apoptotic HSCs in IFN-α preventing group. EM×15000; C: TGF-β1 expression in portal area and fiber space in model group. SABC×100; D: Expression of TGF-β1 in hepatic tissue in IFN-α preventing group. SABC×100; E: α-SMA positive cells in portal area and fiber space in model group. SABC ×400; F: α-SMA positive cells in IFN-α preventing group. SABC×400.
- Citation: Chang XM, Chang Y, Jia A. Effects of interferon-alpha on expression of hepatic stellate cell and transforming growth factor-β1 and α-smooth muscle actin in rats with hepatic fibrosis. World J Gastroenterol 2005; 11(17): 2634-2636
- URL: https://www.wjgnet.com/1007-9327/full/v11/i17/2634.htm
- DOI: https://dx.doi.org/10.3748/wjg.v11.i17.2634


