Copyright
©2005 Baishideng Publishing Group Inc.
World J Gastroenterol. May 7, 2005; 11(17): 2603-2608
Published online May 7, 2005. doi: 10.3748/wjg.v11.i17.2603
Published online May 7, 2005. doi: 10.3748/wjg.v11.i17.2603
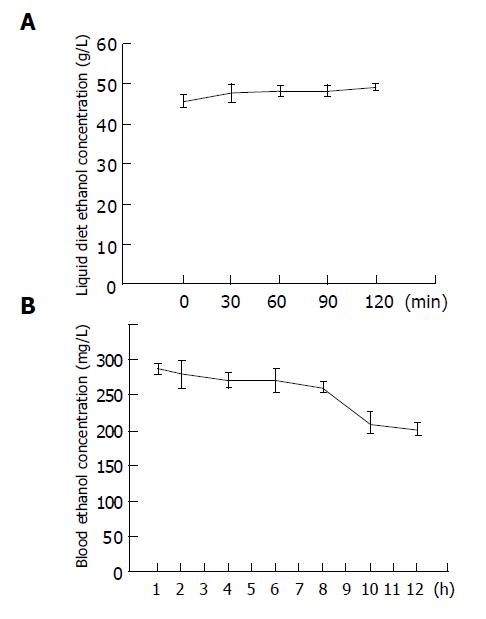
Figure 1 Changes in the ethanol concentrations of liquid diet (A) and blood (B) after ethanol feeding.
Data are expressed as mean±SE (n = 10).
- Citation: Huang CC, Chen JR, Liu CC, Chen KT, Shieh MJ, Yang SC. Effects of long-term ethanol consumption on jejunal lipase and disaccharidase activities in male and female rats. World J Gastroenterol 2005; 11(17): 2603-2608
- URL: https://www.wjgnet.com/1007-9327/full/v11/i17/2603.htm
- DOI: https://dx.doi.org/10.3748/wjg.v11.i17.2603


