Copyright
©2005 Baishideng Publishing Group Inc.
World J Gastroenterol. Apr 21, 2005; 11(15): 2296-2305
Published online Apr 21, 2005. doi: 10.3748/wjg.v11.i15.2296
Published online Apr 21, 2005. doi: 10.3748/wjg.v11.i15.2296
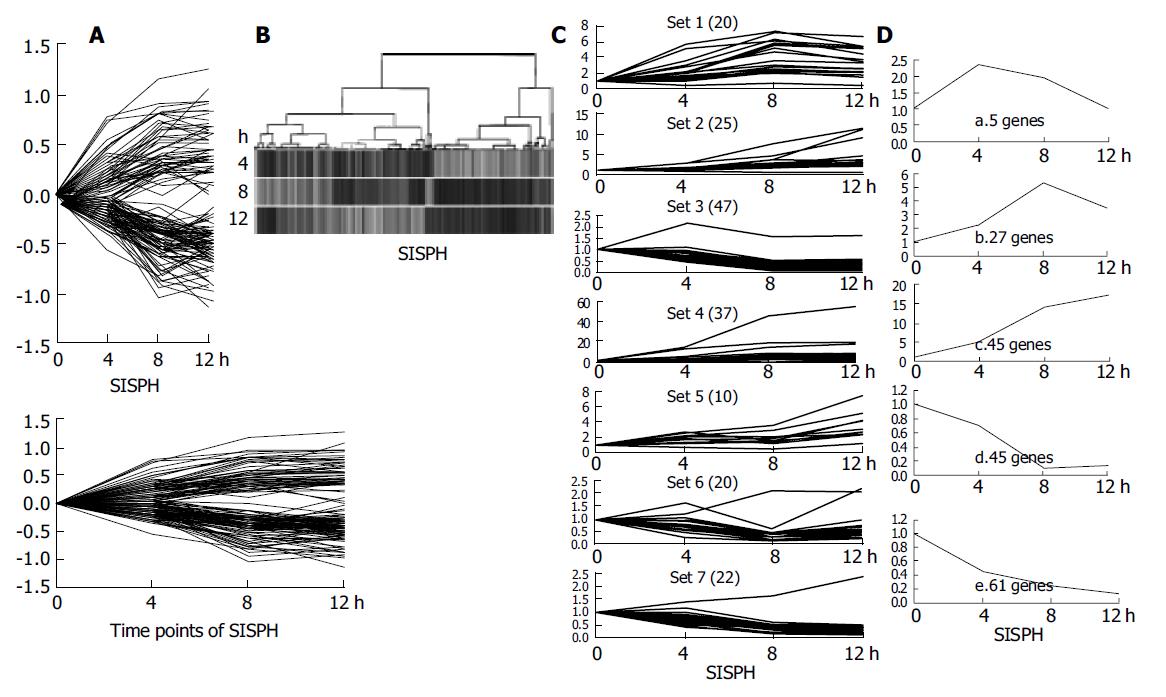
Figure 3 Cluster analysis of 185 elements.
A: The difference of their intensity was identified more than 2-fold at least at one time point; B: A hierarchical clustering of five time points indicated that the genes in these time points hardly had a common expression profile; C: The k-means method was used and these genes were classified into seven clusters; D: Five distinct temporal patterns were designated. a. Immediate induction; b. Late induction; c. Consistent induction; d. Late suppression; e. Consistent suppression.
- Citation: Xu CS, Yuan JY, Li WQ, Han HP, Yang KJ, Chang CF, Zhao LF, Li YC, Zhang HY, Rahman S, Zhang JB. Identification of expressed genes in regenerating rat liver in 0-4-8-12 h short interval successive partial hepatectomy. World J Gastroenterol 2005; 11(15): 2296-2305
- URL: https://www.wjgnet.com/1007-9327/full/v11/i15/2296.htm
- DOI: https://dx.doi.org/10.3748/wjg.v11.i15.2296


