Copyright
©2005 Baishideng Publishing Group Inc.
World J Gastroenterol. Mar 28, 2005; 11(12): 1837-1842
Published online Mar 28, 2005. doi: 10.3748/wjg.v11.i12.1837
Published online Mar 28, 2005. doi: 10.3748/wjg.v11.i12.1837
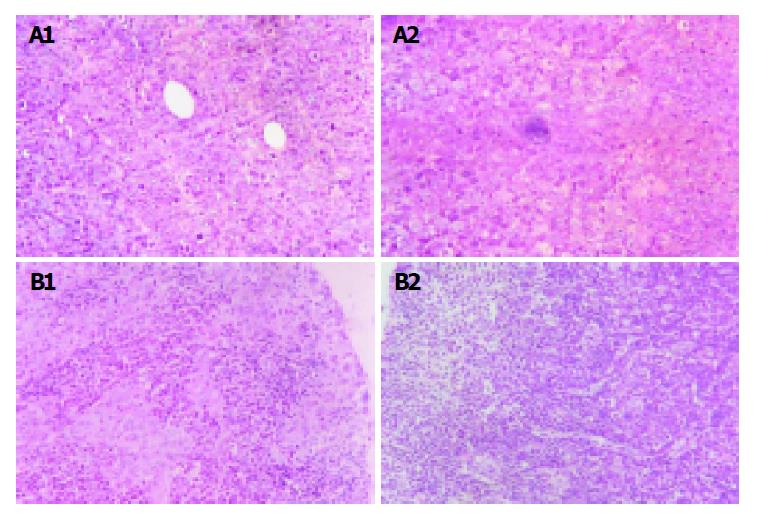
Figure 1 Lymph node metastatic rates of Hca-F and Hca-P.
A: Implanted tumor of Hca-F cells and Hca-P cells. H.E. ×400. (1) Implanted tumor of Hca-F cells. (2) Implanted tumor of Hca-P cells; B: Regional lymph node of implanted tumor of Hca-F cells and Hca-P cells. H.E. ×400. (1) Regional lymph node of implanted tumor of Hca-F cells. (2) Regional lymph node of implanted tumor of Hca-P cells.
- Citation: Cui XN, Tang JW, Hou L, Song B, Li L, Liu JW. Screening differentially expressed genes in mouse hepatocarcinoma ascites cell line with high potential of lymphatic metastasis. World J Gastroenterol 2005; 11(12): 1837-1842
- URL: https://www.wjgnet.com/1007-9327/full/v11/i12/1837.htm
- DOI: https://dx.doi.org/10.3748/wjg.v11.i12.1837


