Copyright
©2005 Baishideng Publishing Group Inc.
World J Gastroenterol. Mar 14, 2005; 11(10): 1411-1419
Published online Mar 14, 2005. doi: 10.3748/wjg.v11.i10.1411
Published online Mar 14, 2005. doi: 10.3748/wjg.v11.i10.1411
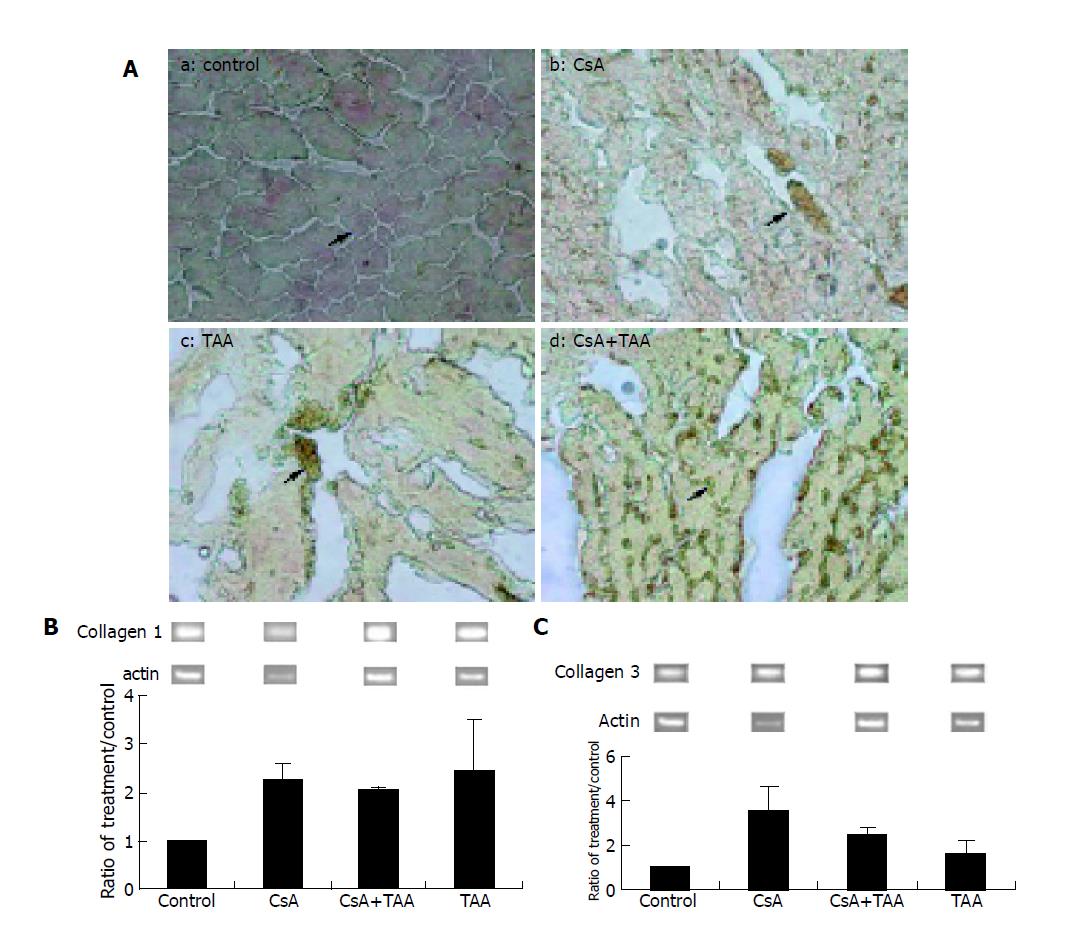
Figure 2 Levels of (A) collagen staining, (B) collagen 1 RNA expression, and (C) collagen 3 RNA expression in rat liver after various treatments.
Immunocytochemistry of collagen (red) was stained by using Sirius red. Magnification = ×200. The expression levels of collagen 1 and 3 were measured by using semi-quantitative PCR.
- Citation: Fan S, Weng CF. Co-administration of cyclosporine A alleviates thioacetamide-induced liver injury. World J Gastroenterol 2005; 11(10): 1411-1419
- URL: https://www.wjgnet.com/1007-9327/full/v11/i10/1411.htm
- DOI: https://dx.doi.org/10.3748/wjg.v11.i10.1411


