Copyright
©The Author(s) 2004.
World J Gastroenterol. Apr 15, 2004; 10(8): 1152-1156
Published online Apr 15, 2004. doi: 10.3748/wjg.v10.i8.1152
Published online Apr 15, 2004. doi: 10.3748/wjg.v10.i8.1152
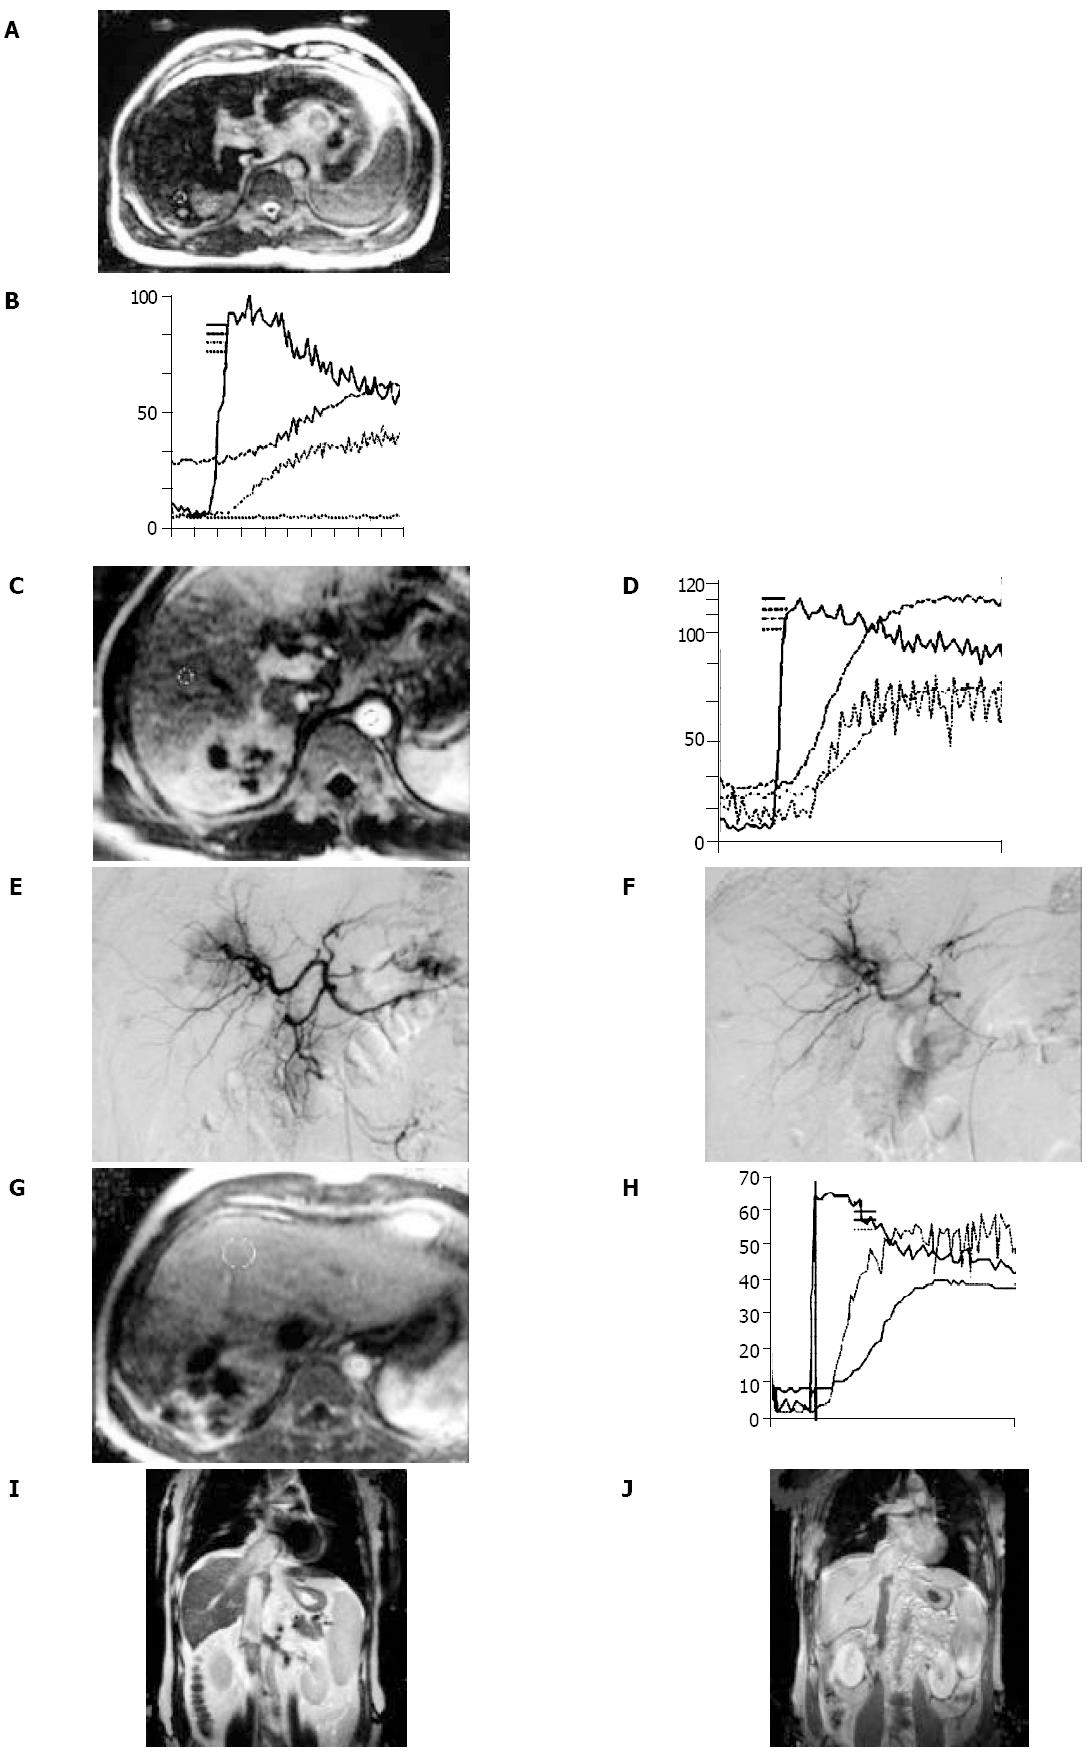
Figure 2 HCC before and after TACE.
(A-B) FP-MRI and the signal intensity time curve derived from ROIs before TACE. (C-D) FP-MRI and the signal intensity time curve one month after TACE, the signal intensity time curve became steeper than that pre-TACE, indicating the remaining arterial blood supply of the lesion after TACE. (E) DSA before TACE and (F) DSA after TACE confirmed the FP-MRI finding. (G-H) one year after TACE, the lesion became larger and the signal intensity time curve became much steeper than that one month after TACE, suggesting the recurrence of the tumor. (I-J) T2 weighted image and enhanced T1 weighted image showing embolus in inferior vena cava and atrium dextrum.
- Citation: Zhao JG, Feng GS, Kong XQ, Li X, Li MH, Cheng YS. Assessment of hepatocellular carcinoma vascularity before and after transcatheter arterial chemoembolization by using first pass perfusion weighted MR imaging. World J Gastroenterol 2004; 10(8): 1152-1156
- URL: https://www.wjgnet.com/1007-9327/full/v10/i8/1152.htm
- DOI: https://dx.doi.org/10.3748/wjg.v10.i8.1152


