Copyright
©The Author(s) 2004.
World J Gastroenterol. Jan 15, 2004; 10(2): 279-283
Published online Jan 15, 2004. doi: 10.3748/wjg.v10.i2.279
Published online Jan 15, 2004. doi: 10.3748/wjg.v10.i2.279
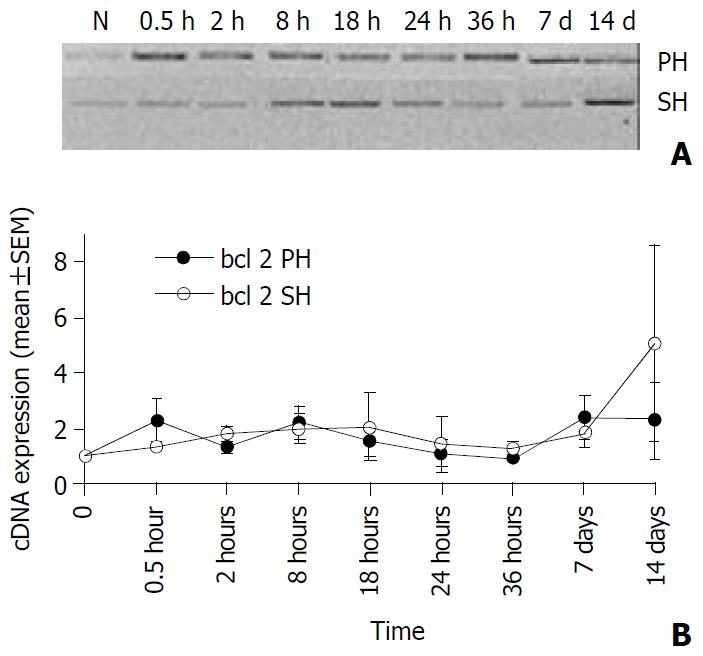
Figure 3 A: The expression of bcl-2 in 70% hepatectomized (PH) and sham (SH) groups shown in 1.
2 % agarose gel. B: The quantitated expression of bcl-2 in 70% PH (__·__) or sham (__o__) groups. Results were expressed as mean ± SEM of triplicate animals with n=3 rats per time point. The expressions were quantitated with the expression of cyclophilin for each sample and analyzed using the Multi-Analyst software. The expres-sion at “time 0” denoted the quantitated expression of bcl-2 in normal liver and was accepted as “1”. Comparing the mean values at each time point, we found no difference in bcl-2 val-ues between PH and SH group.
- Citation: Akcali KC, Dalgic A, Ucar A, Haj KB, Guvenc D. Expression of bcl-2 family of genes during resection induced liver regeneration: Comparison between hepatectomized and sham groups. World J Gastroenterol 2004; 10(2): 279-283
- URL: https://www.wjgnet.com/1007-9327/full/v10/i2/279.htm
- DOI: https://dx.doi.org/10.3748/wjg.v10.i2.279


