Copyright
©The Author(s) 2004.
World J Gastroenterol. Oct 1, 2004; 10(19): 2859-2863
Published online Oct 1, 2004. doi: 10.3748/wjg.v10.i19.2859
Published online Oct 1, 2004. doi: 10.3748/wjg.v10.i19.2859
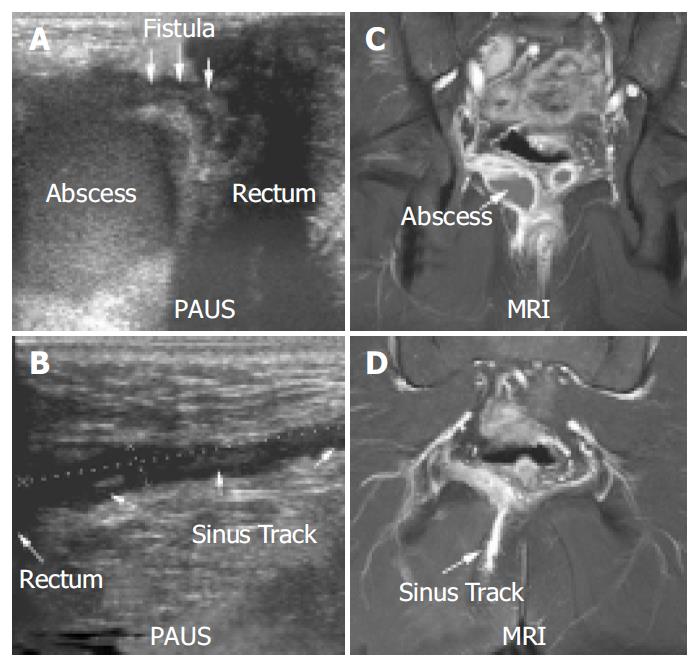
Figure 6 PAUS (A + B) and MRI (C + D) imaging (coronary fat-saturated T1-SE sequence after gadolinium administration) of a perianal abscess.
In contrast to MRI, PAUS was able to clearly identify a connection between the rectum and the abscess (A + C). Both methods could identify a sinus track that began within the abscess and ended in the gluteal fat (B + D). A scale (cm) is shown on the left side of the PAUS images for orientation.
- Citation: Wedemeyer J, Kirchhoff T, Sellge G, Bachmann O, Lotz J, Galanski M, Manns MP, Gebel MJ, Bleck JS. Transcutaneous perianal sonography: A sensitive method for the detection of perianal inflammatory lesions in Crohn’s disease. World J Gastroenterol 2004; 10(19): 2859-2863
- URL: https://www.wjgnet.com/1007-9327/full/v10/i19/2859.htm
- DOI: https://dx.doi.org/10.3748/wjg.v10.i19.2859


